Current version 0.4
New: Now includes #Statistical Comparisons, and more complete set of histograms
Installation
- Make sure you have Java 1.4 installed (you probably have it for vrvs). If not install from: http://www.java.com/
- Download and install JAS3 0.7.6 (or later) from http://jas.freehep.org/jas3/download.html
- Start JAS3, from the menu select View, Plugin Manager. Click on the "Available" tab (if it shows no plugins available close the plugin manager, wait a few seconds, and then try again. It needs to download the list of plugins from SLAC and sometimes it takes a few seconds).
- In the tree select astro->glast->Glast System Tests
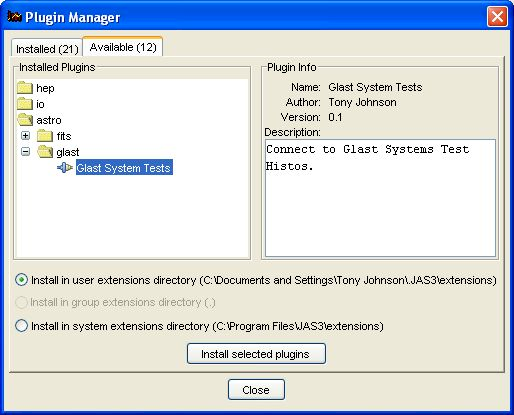
- Select Install selected plugins.
- If new versions of the plugin become available you will be informed when you start JAS3, and can choose to install the new version automatically.
Running
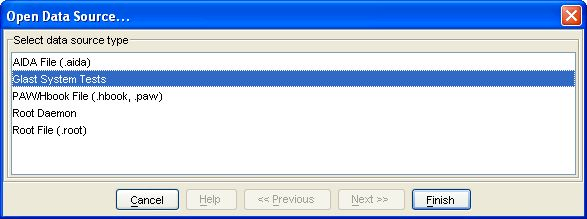
- From the JAS3 menu select File, Open Data Source. Select Glast System Tests and click Finish
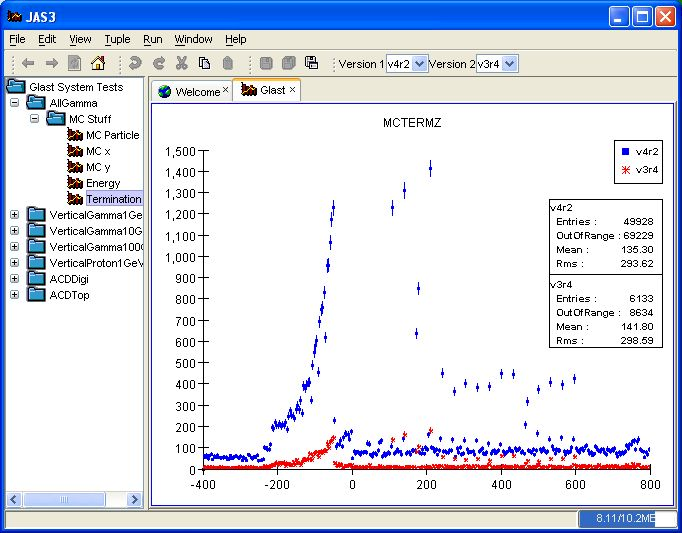
- Use the toolbar to select which versions you want to compare.
- Drill down in the tree to select plot of interest. Double click to view plot.
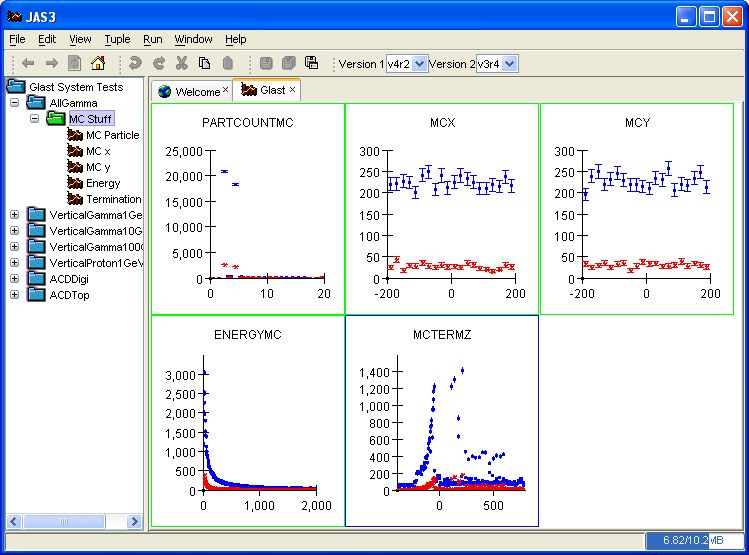
- Select a folder, such as MC Stuff, right click to bring up popup menu, choose "Show All" to show all plots in that folder
- To close the glast system tests bring up the popup menu on the "Glast System Tests" node and choose close.
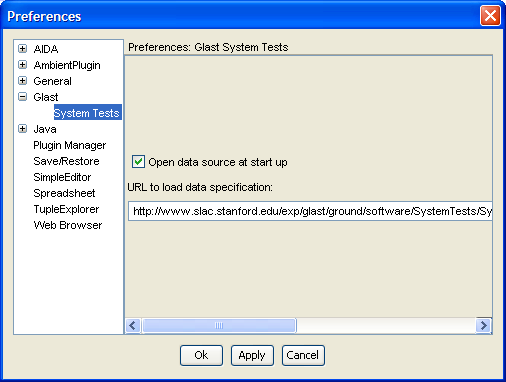
- By default the XML file describing the systems tests is read from: http://www.slac.stanford.edu/exp/glast/ground/software/SystemTests/SystemTests.xml. This can be changed (for testing or experimenting) by selecting View/Preferences from the JAS menu, selecting Glast/SystemTests in the tree, and entering a new URL. Note that you will need to close the "Glast System Tests" node and reopen it (see above) before the new URL will take effect. Changes to the default options are persistent across subsequent invocations of JAS3.
Statistical Comparisons
- You can now right click on any node in the tree (except the root node) and select either
"Statistical Comparison in Folder" or "Recursive Statistical Comparison". This will result in a table being displayed showing the result of applying various comparison algorithms to the data.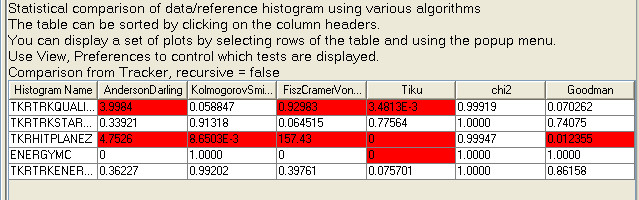
- The table can be sorted based on any column by clicking on the column header. Comparisons which are out of tolerance are highlighted in red.
- You can select any rows of the table, and use the popup menu to display the corresponding plots. So you can easily sort on a column to get the worst results at the top, select the top rows, and then plot all of the out-of-tolerance plots.
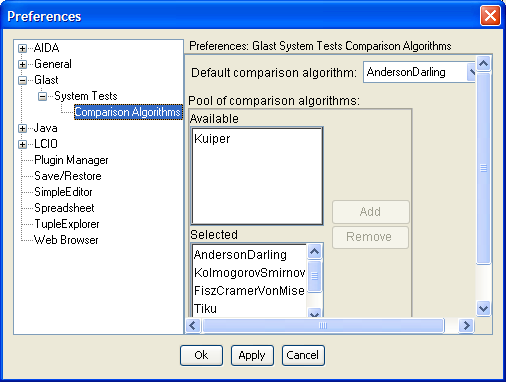
- You can control which algorithms are used by default by use the preferences dialog.
Current Limitations/Bugs
- Data is read from rootd at SLAC, so network connection is needed to view data. In future it should also be possible to download data, or use data already cached on disk ("offline mode").
- rootd on glast03 is currently configured to only accept connections from slac.stanford.edu nodes, so you will need to use VPN to connect from offsite.
- There is some problem with the root daemon on glast03, where sometime it refuses to accept additional connections resulting in a "timeout" message. We are investigating this.
- Currently only "MC Stuff" plots are shown (others just need to be added to XML file)
- We should support dragging plots onto different regions of the page, and selecting arbitrary sets of plots to display on a page (this is supported in other JAS3 plugins and should be easy to add).
- When the versions are changed, currently displayed plots should update.
...