Report
See https://mybroadband.co.za/news/internet/336416-how-south-africas-internet-survived-cable-breaks.html and the aftermath at https://mybroadband.co.za/news/internet/336426-slow-internet-speeds-in-south-africa-at-least-12-more-days.html.
Both the SAT-3 and WACS undersea cable were damaged Jan 16, 2020. The cable systems are deployed in the Atlantic Ocean and connect various African countries to Europe – including South Afric. According to reports, the issue with the SAT-3 is believed to have been located near Libreville, Gabon. WACs meanwhile is believed to have suffered two faults one of the coast of congo and another near the UK. This affected more than a dozen countries besides South Africa. This left many South Africans with slow Internet connections to international websites. a. That leaves Africa Coast to Coast (ACE) and Equiano providing access to Europe and beyond and SAFE providing access via India and Malaysia and the South Africa Express (SAEx2) which will provide access via India and Malaysia in 2021.
“[The cable ship] Leon Thevenin on its way to the WACS S1i cable grounds,” TENET said. “We have a provisional repair date of the 8th February for the WACS cable system.”
“SAT-3 will be attended to thereafter. This information may be subject to change.”
Cable Maps
Maps of the cables (from https://www.submarinecablemap.com/) to Europe are shown below:
| SAT3 (RFS 2002 April) | WACS (RFS 2012 May) | ACE (RFS 2012 December) | Equiano (RFS 2021) |
|---|---|---|---|
 |  | 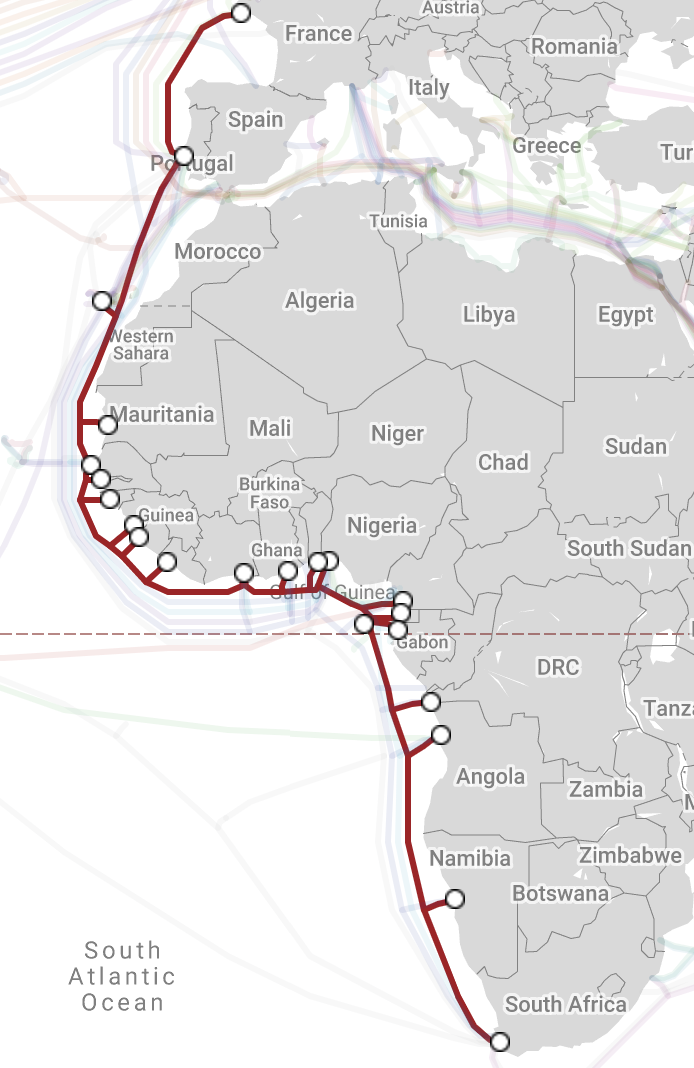 |  |
Cables going East to India and Malaysia are shown below.
| SAFE (RFS 2002 April) | South Asia Express (SAEx2) (RFS 2021 Q1) |
|---|---|
 |  |
RFS = Ready For Service so the current backups to Europe and probably the US are ACE going West and possibly SAFE going East.
Result as observed by PingER
Looking at the minimum RTT seen from SLAC to 20 targets in Southern Africa we see a step function going from a 25%-75% of ~ 300-320 ms to 325-355ms. See the statistics below.
Minimum RTT measured every 30 minutes for Sites in Southern AFRICA seen from EDU.SLAC.STANFORD.PINGER
| Tick | min | 25th% | avg | median | 75th% | 90th% | 95th% | max | iqr | std dev | # pairs |
|---|---|---|---|---|---|---|---|---|---|---|---|
| 20Jan01 | 280.444 | 303.117 | 312.614 | 316.141 | 321.182 | 325.130 | 325.531 | 329.477 | 18.065 | 12.637 | 20 |
| 20Jan02 | 280.498 | 297.056 | 309.626 | 314.285 | 317.884 | 324.135 | 324.826 | 325.112 | 20.828 | 12.793 | 20 |
| 20Jan03 | 280.517 | 303.163 | 312.347 | 316.178 | 321.177 | 324.280 | 324.960 | 329.499 | 18.014 | 12.433 | 20 |
| 20Jan04 | 280.461 | 303.154 | 312.365 | 316.158 | 321.146 | 324.649 | 324.978 | 329.489 | 17.992 | 12.457 | 20 |
| 20Jan05 | 280.447 | 303.144 | 312.051 | 316.130 | 321.151 | 324.690 | 324.943 | 329.539 | 18.007 | 12.395 | 20 |
| 20Jan06 | 280.451 | 296.392 | 310.530 | 315.753 | 320.903 | 324.763 | 324.981 | 329.496 | 24.511 | 13.628 | 20 |
| 20Jan07 | 280.468 | 296.436 | 310.834 | 315.841 | 321.240 | 324.988 | 325.506 | 329.450 | 24.804 | 13.775 | 20 |
| 20Jan08 | 280.476 | 303.144 | 311.708 | 314.254 | 321.011 | 325.028 | 325.524 | 329.554 | 17.867 | 12.457 | 20 |
| 20Jan09 | 280.518 | 303.151 | 311.782 | 314.255 | 319.939 | 323.939 | 325.036 | 328.314 | 16.788 | 11.658 | 20 |
| 20Jan10 | 280.465 | 300.798 | 309.671 | 311.542 | 315.925 | 324.952 | 325.496 | 328.318 | 15.127 | 12.842 | 20 |
| 20Jan11 | 280.474 | 301.814 | 309.915 | 311.603 | 315.171 | 325.012 | 325.430 | 329.738 | 13.357 | 12.748 | 20 |
| 20Jan12 | 280.515 | 296.730 | 311.775 | 315.344 | 322.416 | 324.938 | 329.779 | 330.877 | 25.686 | 14.228 | 20 |
| 20Jan13 | 280.429 | 305.275 | 311.683 | 313.730 | 316.397 | 325.007 | 325.491 | 329.706 | 11.122 | 12.046 | 20 |
| 20Jan14 | 280.531 | 303.975 | 309.400 | 311.155 | 315.672 | 318.695 | 324.584 | 329.770 | 11.697 | 11.031 | 20 |
| 20Jan15 | 296.380 | 305.315 | 313.079 | 312.597 | 318.192 | 324.055 | 325.876 | 336.248 | 12.877 | 9.760 | 20 |
| 20Jan16 | 296.726 | 305.008 | 313.498 | 312.889 | 319.100 | 325.828 | 328.229 | 336.273 | 14.092 | 10.343 | 20 |
| 20Jan17 | 301.328 | 330.032 | 348.988 | 348.759 | 355.767 | 387.082 | 392.328 | 408.823 | 25.735 | 25.731 | 20 |
| 20Jan18 | 301.306 | 330.101 | 345.969 | 348.990 | 355.285 | 366.246 | 385.621 | 389.538 | 25.184 | 21.546 | 20 |
| 20Jan19 | 301.268 | 329.970 | 346.692 | 346.227 | 355.276 | 385.389 | 389.286 | 396.487 | 25.306 | 24.191 | 20 |
| 20Jan20 | 301.307 | 327.376 | 342.864 | 340.419 | 352.677 | 369.400 | 386.111 | 389.233 | 25.301 | 22.337 | 20 |
| 20Jan21 | 301.146 | 327.248 | 346.865 | 342.833 | 352.699 | 396.258 | 412.843 | 415.990 | 25.451 | 30.435 | 20 |
| 20Jan22 | 301.350 | 323.368 | 341.581 | 339.179 | 352.644 | 369.499 | 386.202 | 389.188 | 29.276 | 23.344 | 20 |
| 20Jan23 | 305.829 | 324.277 | 342.455 | 339.436 | 352.019 | 369.405 | 386.094 | 389.259 | 27.742 | 22.234 | 20 |
| 20Jan24 | 305.722 | 323.285 | 341.580 | 338.587 | 352.055 | 366.430 | 386.448 | 389.562 | 28.770 | 22.446 | 20 |
| 20Jan25 | 305.680 | 324.671 | 342.747 | 340.071 | 351.452 | 369.217 | 385.966 | 389.601 | 26.781 | 22.061 | 20 |
| 20Jan26 | 305.761 | 323.724 | 343.401 | 349.319 | 356.299 | 386.491 | 389.553 | 389.553 | 32.575 | 22.892 | 19 |
| 20Jan27 | 305.794 | 321.125 | 341.578 | 338.668 | 352.731 | 369.613 | 386.166 | 389.261 | 31.606 | 23.321 | 20 |
The targets are
For the 7 targets in South Africa the 25%/median/75% before 2016 and after are ~294/300/306ms and 327/345/356ms.
Looking in more detail at the ping responses each hour we see a sudden step

and in more detail

The first step occurred between 08:00am and 09:00am Jan 14th, the second step between 07:00am and 08:00am Jan 16th (both times are GMT). I can find no evidence of a failure on January 14th, however it sure looks like there was one. On further inspection, it appears that this step only appears for the TENET target site (see below for the minimum RTTs measured each hour (0 1 ...) from SLAC to the target (Remote-Site) on Jan 14th, 2020), and thus is not related to the cable problems.
Monitoring-Site           Remote-Site            ?   0        1        2        3        4        5        6        7        8        9        10       11       12       13       14       15       16       17       18       19       20       21       22       23       Monitoring-Node           Mon-TLD  Mon-Region     Remote-Node                   Rem-TLD Rem-Region
EDU.SLAC.STANFORD.PINGER  ZA.AC.NMMU.N1          ?r  303.254  303.259  303.252  303.242  303.222  303.224  303.260  303.255  303.253  303.287  303.260  303.199  303.190  303.171  303.267  303.228  303.282  303.280  303.265  303.179  303.139  303.188  303.173  303.249  pinger.slac.stanford.edu  EDU      North_America  www.nmmu.ac.za                ZA       Africa
EDU.SLAC.STANFORD.PINGER  ZA.AC.NWU.N1           ?r  .        .        .        .        .        .        .        .        .        .        .        .        .        .        .        .        .        .        .        .        .        .        .        .        pinger.slac.stanford.edu  EDU      North_America  www.nwu.ac.za                 ZA       Africa
EDU.SLAC.STANFORD.PINGER  ZA.BONTANY.UWC.AC.N1   ?r  315.577  315.549  315.543  315.623  315.598  315.537  315.603  315.560  315.556  315.569  336.325  336.267  336.290  336.224  336.356  336.402  336.354  336.385  336.349  336.416  336.351  336.299  336.341  336.421  pinger.slac.stanford.edu  EDU      North_America  196.21.45.139                 ZA       Africa
EDU.SLAC.STANFORD.PINGER  ZA.DUT.AC.N1           ?r  306.191  306.324  306.287  306.328  306.377  306.398  306.441  306.591  306.860  306.605  306.572  306.618  306.578  306.474  306.455  306.428  306.346  306.378  306.491  306.318  306.284  306.395  306.262  306.248  pinger.slac.stanford.edu  EDU      North_America  www.dut.ac.za                 ZA       Africa
EDU.SLAC.STANFORD.PINGER  ZA.MUSEUMSNC.CO        ?r  305.339  305.407  305.384  305.513  305.397  305.504  305.418  305.434  305.378  305.498  304.907  304.774  304.900  305.073  305.491  305.404  305.437  305.478  305.808  305.546  311.584  305.420  305.553  305.436  pinger.slac.stanford.edu  EDU      North_America  www.museumsnc.co.za           ZA       Africa
EDU.SLAC.STANFORD.PINGER  ZA.RU.AC.N1            ?r  306.200  306.242  306.202  306.153  306.186  306.186  306.246  306.178  306.193  306.206  306.217  306.114  306.129  306.057  306.227  306.228  306.166  306.149  306.203  306.129  306.131  306.161  306.118  306.243  pinger.slac.stanford.edu  EDU      North_America  www.ru.ac.za                  ZA       Africa
EDU.SLAC.STANFORD.PINGER  ZA.SAGRID.AC.N1        ?r  294.901  294.915  294.805  294.903  294.892  294.889  294.856  294.905  294.873  294.897  306.606  306.592  306.546  306.530  306.675  306.643  306.603  306.616  306.597  306.578  306.555  306.573  306.613  306.609  pinger.slac.stanford.edu  EDU      North_America  sagrid.ac.za                  ZA       Africa
EDU.SLAC.STANFORD.PINGER  ZA.TECHCONCEPTS.CO.N1  ?r  .        .        .        .        .        .        .        .        .        .        .        .        .        .        .        .        .        .        .        .        .        .        .        .        pinger.slac.stanford.edu  EDU      North_America  speedtest.techconcepts.co.za  ZA       Africa
EDU.SLAC.STANFORD.PINGER  ZA.TENET.AC.N1         ?M  280.581  280.644  280.561  280.593  280.590  280.626  280.597  280.531  280.614  301.662  301.652  301.571  301.545  301.668  301.701  301.725  301.650  301.724  301.577  301.644  301.540  301.622  301.704  301.707  pinger.slac.stanford.edu  EDU      North_America  brunsvigia.tenet.ac.za        ZA       Africa
Monitoring-Site   Remote-Site   ?   0   1   2   3   4   5   6   7   8   9   10   11   12   13   14   15   16   17   18   19   20   21   22   23   Monitoring-Node   Mon-TLD  Mon-Region   Remote-Node   Rem-TLD  Rem-Region
Traceroute
The route measured 19:00 hrs 1/28/2020 PST from SLAC to South Africa goes East across the US via Chicago, Washinton to London and thence S. Africa:
Tue Jan 28 18:59:32 2020: executing exec(traceroute -m 30 -q 1 -w 1 -A 196.24.110.67 140)=traceroute from 134.79.197.214(www.slac.stanford.edu) to  196.24.110.67(brunsvigia.tenet.ac.za) for 134.79.138.4
traceroute to 196.24.110.67 (196.24.110.67), 30 hops max, 140 byte packets
 1  rtr-serv01-02-serv01-dmz-webserv.slac.stanford.edu (134.79.197.131) [AS3671]  0.788 ms
 2  rtr-core2-p2p-serv01-01.slac.stanford.edu (134.79.254.65) [AS3671]  0.591 ms
 3  rtr-fwcore1-trust-p2p-core1.slac.stanford.edu (134.79.254.134) [AS3671]  1.123 ms
 4  rtr-core1-p2p-fwcore1-untrust.slac.stanford.edu (134.79.254.137) [AS3671]  1.538 ms
 5  rtr-border1-7k-p2p-core1.slac.stanford.edu (134.79.252.173) [AS3671]  1.482 ms
 6  rtr-border2-7k-p2p-border1-7k.slac.stanford.edu (192.68.191.214) [AS3671]  1.614 ms
 7  sunn-cr5-ip-p2p-border2-7k.slac.stanford.edu (192.68.191.233) [AS3671]  1.858 ms
 8  134.55.40.145 (134.55.40.145) [AS293]  4.548 ms
 9  134.55.40.150 (134.55.40.150) [AS293]  46.417 ms
10  washcr5-ip-a-chiccr5.es.net (134.55.36.46) [AS293]  63.692 ms
11  *
12  londcr5-ip-c-aofacr5.es.net (134.55.37.22) [AS293]  138.575 ms
13  *
14  lt-0-0-0-2-ldn1-ir1.net.tenet.ac.za (155.232.208.28) [AS2018]  331.160 ms
15  londcr5-sdn-a-newycr5.es.net (134.55.220.21) [AS293]  137.494 ms
16  xe-11-3-0-201-ldn1-ir1.net.tenet.ac.za (155.232.212.106) [AS2018]  137.352 ms
17  lt-0-3-0-1-mtz1-pe1.net.tenet.ac.za (155.232.152.20) [AS2018]  329.393 ms
18  et-1-0-0-0-ams1-ir1.net.tenet.ac.za (155.232.1.80) [AS2018]  328.407 ms
19  xe-1-3-0-0-isd1-pe2.net.tenet.ac.za (155.232.1.60) [AS2018]  339.301 ms
20  eth3-39-cpt3-p1.net.tenet.ac.za (155.232.1.37) [AS2018]  354.698 ms
21  lt-0-3-0-0-mtz1-pe1.net.tenet.ac.za (155.232.152.21) [AS2018]  330.381 ms
22  et-0-0-1-0-cpt2-p2.net.tenet.ac.za (155.232.64.64) [AS2018]  354.586 ms
23  eth3-39-cpt3-p1.net.tenet.ac.za (155.232.1.37) [AS2018]  353.473 ms
24  et-0-0-1-0-cpt3-p2.net.tenet.ac.za (155.232.64.61) [AS2018]  353.617 ms
25  196.24.111.221 (196.24.111.221) [AS2018]  357.517 ms
26  pinger-cpt-01.tenet.ac.za (196.24.110.67) [AS2018]  354.664 ms
traceroute -m 30 -q 1 -w 1 -A 196.24.110.67 140 took 5secs. Total script traceroute.pl time=5secs,
AS3671 is ESnet and AS2018 is TENET