Search/Navigation:
Related:
SLAC![]() /EPP
/EPP![]() /HPS Public
/HPS Public![]()
Jefferson Lab![]() /Hall B
/Hall B![]() /HPS Run Wiki
/HPS Run Wiki![]()
S30XL-LESA/LDMX
The HPS Monitoring Application is a Java Swing GUI application which provides an online data monitoring framework for the experiment. EVIO and LCIO files can be loaded directly, or EVIO data can be read from an ET server and decoded. The LCIO events built from EVIO can be processed using Drivers defined in an lcsim xml steering file. Plotting is done using the Java AIDA API with a custom JFreeChart based backend.
The application is part of the HPS Java project, so the Installing HPS Java instructions should be followed to build it.
You may also find an hps-distribution jar using a Nexus repository search and download it through the web interface.
The application is activated through its main method and takes only one command line argument, which is the name of a settings properties file.
java -Xmx1g -jar hps-distribution-bin.jar org.hps.monitoring.application.Main -c settings.prop
The settings files are not typically hand edited but created by saving settings from the GUI's menu.
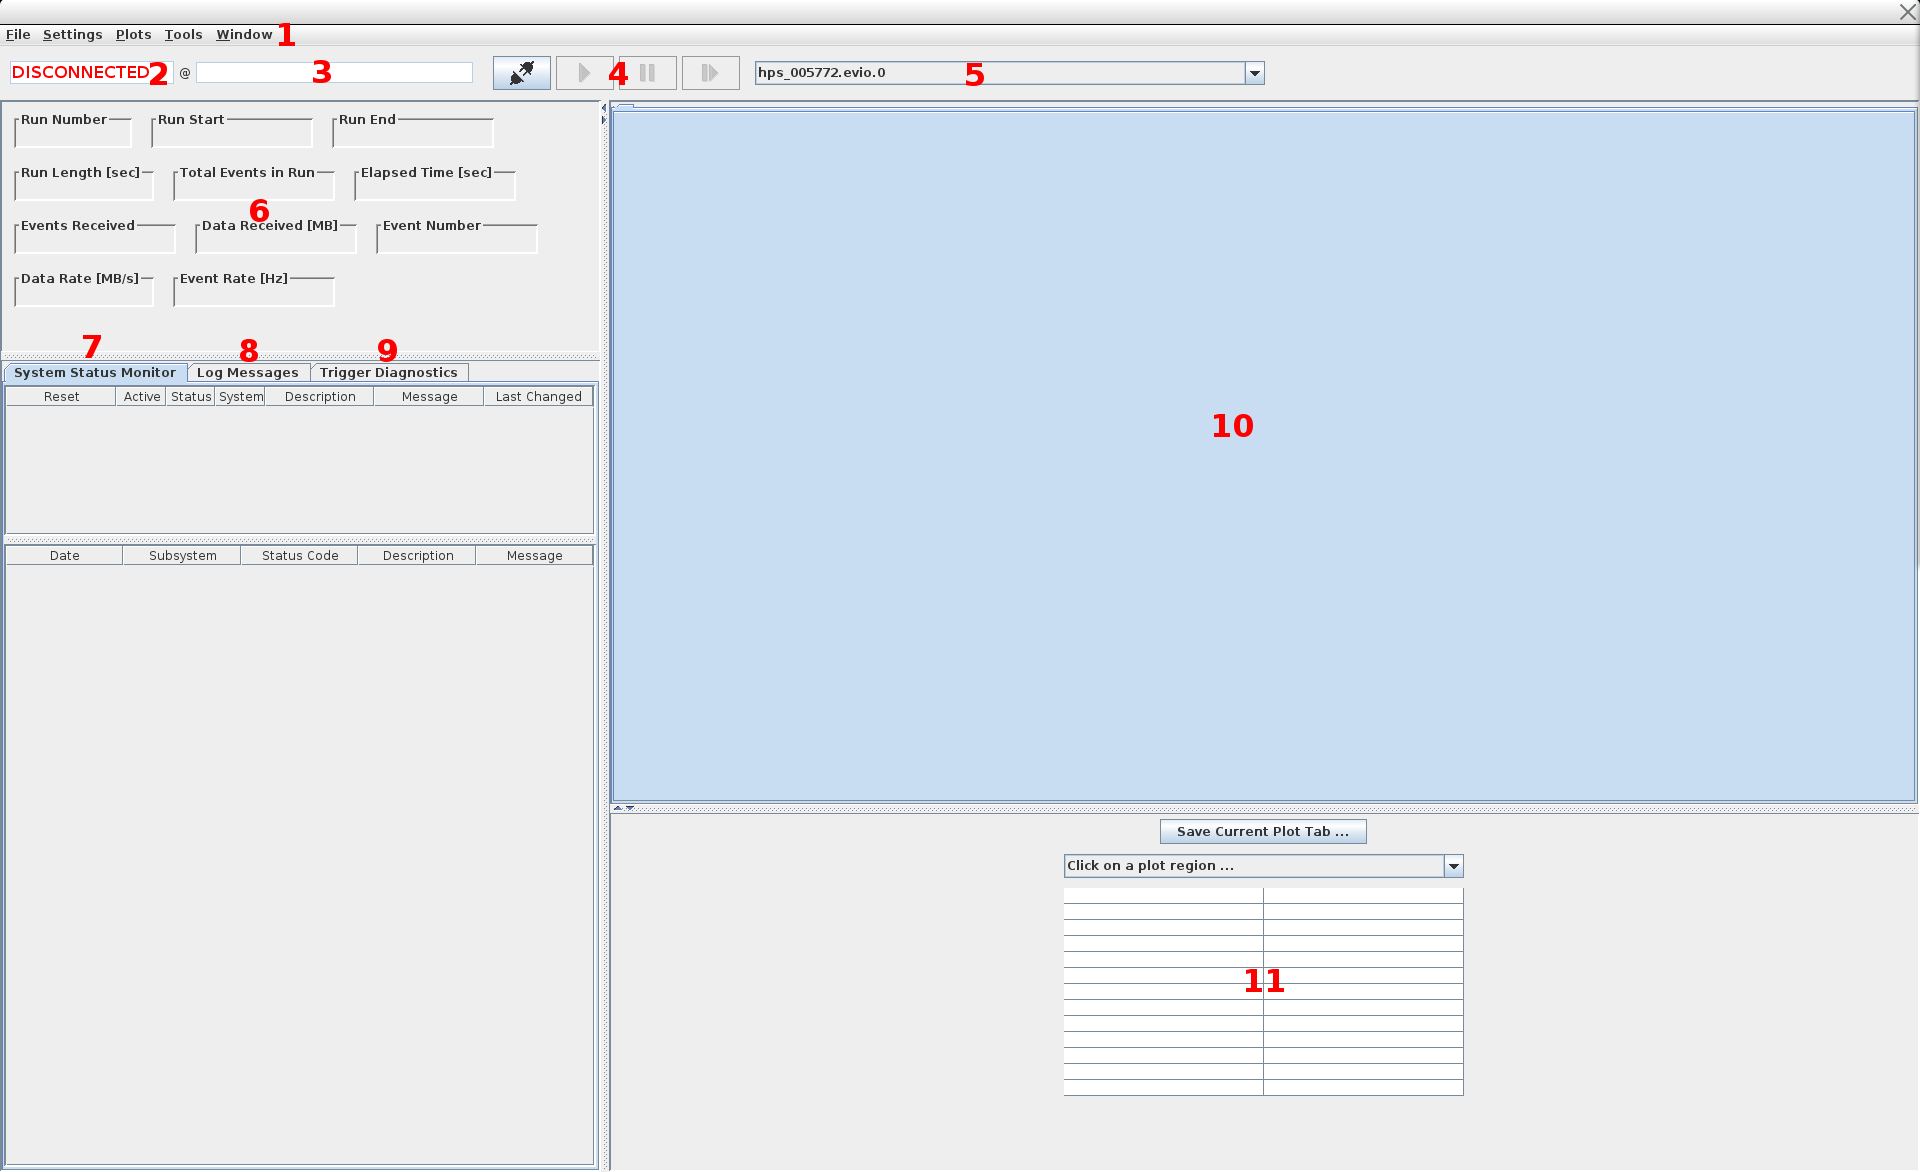
| Label | Name | Description |
|---|---|---|
| 1 | Application Menu Bar | contains menus with commands |
| 2 | Status Panel | application's current status (connected or disconnected) |
| 3 | Date Panel | shows when status last changed |
| 4 | Control Buttons | used to connect, disconnect, pause, continue, etc. |
| 5 | Data Source | available data sources (files or ET) |
| 6 | Event Dashboard | statistics for the current session |
| 7 | System Status Monitor Tab | system status monitoring tables (for alarms) |
| 8 | Log Tab | list of application log messages |
| 9 | Trigger Diagnostics | shows trigger diagnostics info when the right Driver is active in the job |
| 10 | Plot Panel | shows the current set of plots in the session |
| 11 | Plot Info Panel | shows information about the currently selected plot |
You can start a new monitoring session by clicking on the connect button in the GUI.
When the application is disconnected, as it will be just after starting up, the button will look like this.


After connecting, the button's appearance will change.

And the status panel will show the connected status.

When starting a new session, you may have to wait 30 seconds or more for initialization, mostly due to the large amount of data that must be loaded from the conditions database.
The application can be paused to suspend event processing and then step through individual events.
The control buttons will look like this in the un-paused state.

Clicking the pause button will change the buttons so that the play and step buttons are active.

Now you can use the step button on the right to process single events, or event processing can be resumed by pressing the play button.
Settings can be saved under Save Settings in the Settings menu.
Previously saved settings may also be loaded in the application under Load Settings in the Settings menu. You should give these files the extension of .prop to indicate that they are Java properties files. The settings will not take effect until a new session is started. If there is a currently active session, it will not be affected.
Configuring Settings
Settings can be configured in the GUI by clicking on Open Settings Window under the Settings menu.
The first tab contains settings for configuring the application's connection to an ET server.
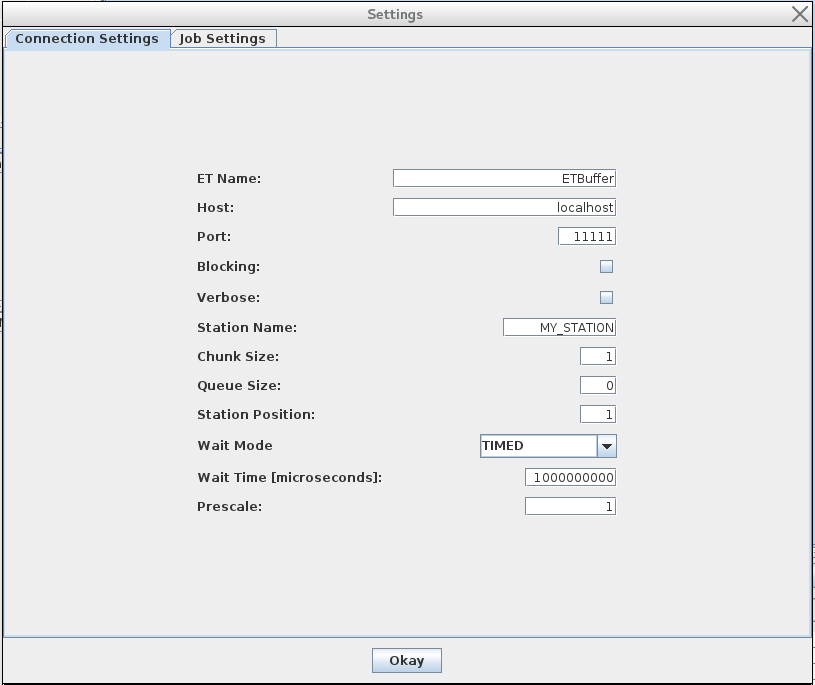
| Setting | Description | Notes |
|---|---|---|
| ET Name | name of the ET buffer file | |
| Host | ET server's TCP/IP hostname | |
| Port | port for connection to server | |
| Blocking | block when reading from ET system | usually should be deselected |
| Verbose | run ET station in verbose mode | |
| Station Name | the name of the ET station used by the monitoring application | should not exist already |
| Chunk Size | number of chunks encoded together | typically one chunk corresponds with an EVIO event |
| Queue Size | the queue (cue?) size | not sure what this means! |
| Station Position | station's position in the chain of ET stations | |
| Wait Mode | wait mode for when events are not immediately available | |
| Wait Time | in timed Wait Mode, determines how long to wait for events before giving up |
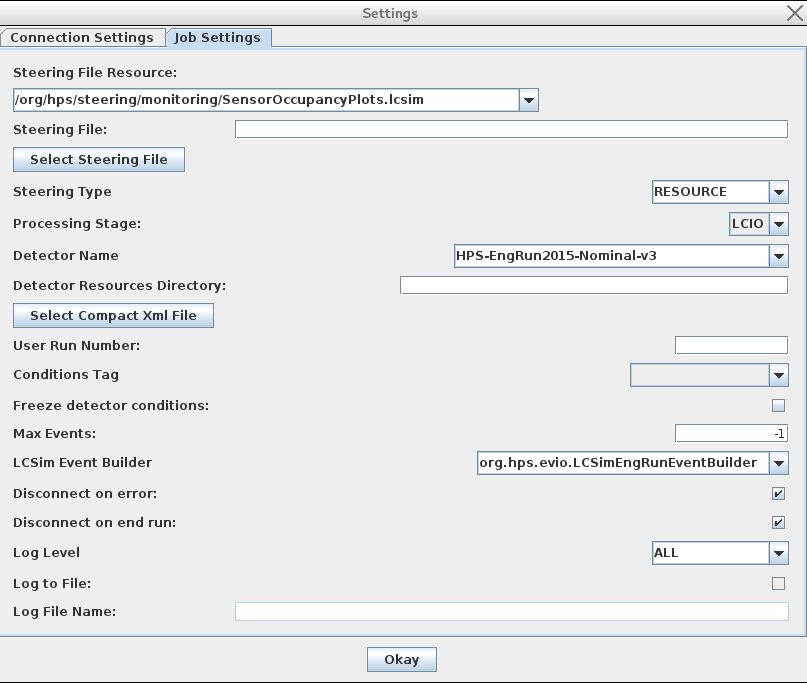
| Setting | Description | Notes |
|---|---|---|
| Steering File Resource | path to steering file jar resource | |
| Steering File | path to steering file on disk | use the Select Steering File button to choose a file |
| Steering Type | choose whether a file or resource is used | determines whether the Steering File or Steering File Resource value is used |
| Processing Stage | limit event processing to a certain stage | event processing will be done up to and including the selected stage |
| Detector Name | name of detector model | |
| Detector Resources Directory | used to select a directory with detector resources | implements detector aliasing as the selected detector may override a known detector |
| User Run Number | provide a run number to override those from the events | |
| Conditions Tag | select a conditions tag for limiting returned conditions data | |
| Freeze Detector Conditions | prevent conditions system from using run numbers in the data | may only be used when run number and detector are provided |
| Max Events | max events to read before disconnecting | -1 means unlimited |
| LCSim Event Builder | select the builder for creating LCSim events | default should be fine |
| Disconnect on error | disconnect if there are any errors | |
| Disconnect on end run | disconnect when run ends | |
| Log to File | log messages to a file instead of the log table | |
| Log File Name | log file name if logging to a file instead of the log table |
A list of recent files is available under Recent Files in the File menu. This has a list of files that were opened using the Open File command.
Files added to this list will not appear automatically if the application is closed and reopened. They must be saved by using the Save Settings menu item under Settings.
The application menu has the following commands.
| Command | Menu | Description |
|---|---|---|
| Open File | File | open an EVIO or LCIO data source |
| Close File | File | close the current data source (removes from Data Source drop down) |
| Recent Files | File | select a recent file |
| Exit | File | exit the application |
| Open Settings Window | Settings | open the Settings Window |
| Load Settings | Settings | load settings from a properties file |
| Save Settings | Settings | save settings to a properties file |
| Load Default Settings | Settings | load the application's default settings |
| Save Plots | Plots | save plots to file (PDF, AIDA, etc.) |
| Clear Plots | Plots | clear the underlying objects in the AIDA data store |
| Save Screenshot | Tools | save a screenshot of the application window |
| Log to File | Tools | log application messages to file rather than Log Table |
| Maximize | Window | maximize the application window |
| Minimize | Window | minimize the application window |
| Restore Defaults | Window | restore the application's default window settings |
EVIO files can be loaded using the Open File menu item under File. These events will be processed using the currently configured event builder to produce in-memory LCIO events which can then be reconstructed.
LCIO files can also be loaded using Open File. These files may contain only the data collections, in which case reconstruction steering should be run. Or these files may already contain reconstruction output.
Data can be read from an ET server (also called ET ring) and converted to EVIO.
A local ET ring can be started from the command line.
java -Xmx2g -cp ./distribution/target/hps-distribution-bin.jar org.jlab.coda.et.apps.StartEt -f ETBuffer -s 20000 -v
Then the EVIO file can be streamed to the ET server using a utility in HPS Java.
java -cp ./distribution/target/hps-distribution-bin.jar org.hps.record.evio.EvioFileProducer -e events.evio -f ETBuffer
In real data taking, the monitoring application will need to be configured to connect properly to the Counting House's ET ring.
The application implements a soft alarm system using its system status monitor component.
Active alarms and a sequential list of system status changes can be viewed in the System Status Monitor tab.
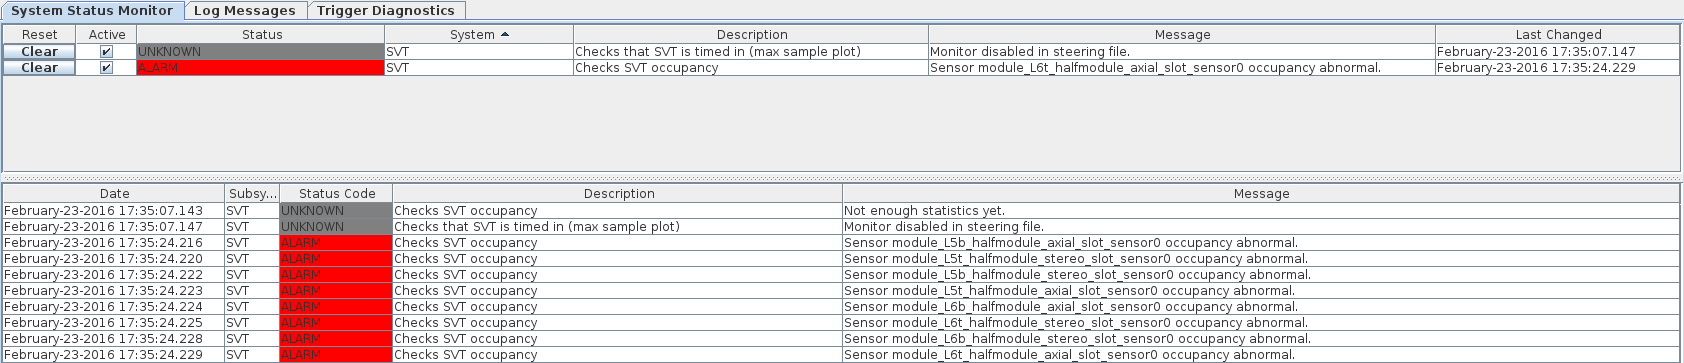
An alarm can be cleared by clicking on its record's Clear button.
Many different monitoring steering files are available under the org.hps.steering.monitoring package in HPS Java. Only steering files in this package will be shown in the Job Settings menu.
| File | Subsystem | Description |
|---|---|---|
| EcalMonitoringFinal.lcsim | ECal | full ECal monitoring plots with event display |
| SensorOccupancyPlots.lcsim | SVT | sensor occupancy plots with system status monitoring |
| TrackingAndReconMonitoring.lcsim | Reconstruction | plots of full reconstruction output |
| SVTMonitoring | SVT | primarily SVT data monitoring plots |
| TriggerDiagnosticsMonitoring.lcsim | Trigger | pushes information to the Trigger Diagnostics Panel |