Beside performing fits by running programs or scripts, JAS3 provides the user an easy to use GUI to quickly perform simple fits.
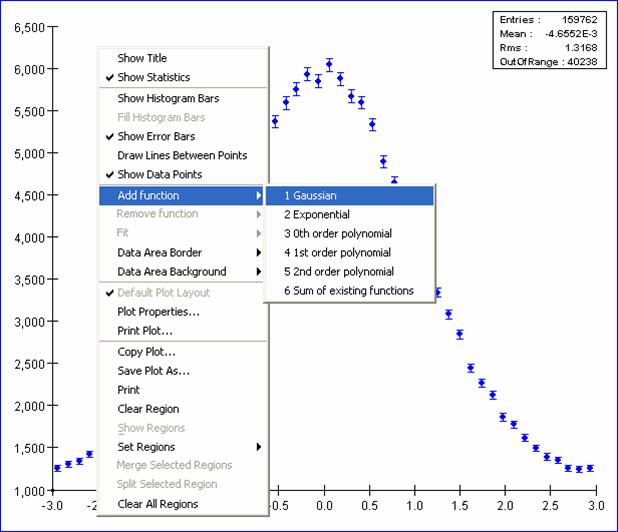
By right clicking on a plot it is possible to add a function to the plot by selecting the Add Function item on the popup menu and selecting a function from a list. In the image below a gaussian is selected:
When adding the function, the function's parameters are calculated internally using the plot's properties in order for the function to fit the screen. The user can then change the function's parameters by moving a set of handles that appear on the function itself. Normally the handles appear as black squares on the function's outline. When the mouse enters an handle's area, the color of the handle switches to red and the cursor changes accordingly in order to show the type of action that is allowed on the selected handle. In the plot below the handle that controls the sigma of the gaussian has been selected and the cursor shows that only horizontal movements are allowed:
!Function Added To Plot!