...
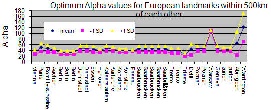
then for all landmarks within say 500km of each other we can measure the min_RTT each landmark to each other landmark (target) and find the average and standard deviations for each landmark. We did this for Europe and N. America and plots of alpha(opt) vs landmark for landmarks within 500km of each other are shown below in plots from the spreadsheet. For spreadsheet eu-na-opt-alpha.xlsx. For Europe it is seen that landmarks on the periphery such as the UK and Poland have larger values of Alpha. Possibly this is since there is less meandering on long the longer distance links.
| |
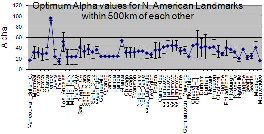
We are still investigating the abive observation above observations against the Intra-State connectivity in North America and through other statistical analysis.
...