...
All these graphs have delay on X-axis and distance on X-axis and in all graphs with filtered caption we have applied the median filter on the values based upon delay. This was just to see the impact of removing the sensitivity to outliers. In this case outliers are those delay values which are not following the trend. E.g. if there are three distance values 400,500,600,700 and their corresponding delay values 10,12,50,17. Here 50 is clearly an outlier. As you can observe a linear increasing trend in European landmarks which is almose absent in North American nodes. This again is depicting a similar observation that Europe has more direct links in contrast to North America. Raw data is available here, Nashville_NA.rar,Atlanta_NA.rar,Paris_France.rar,Darmstadt_Germany.rar.
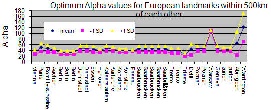
Optimum Alpha Values for Europe and N. America
If we define the optimum value of alpha = alpha(opt) such that the
known distance between a landmark and target = alpha(opt) * min_RTT *100 km.
then for all landmarks within say 500km of each other we can measure the min_RTT each landmark to each other landmark (target) and find the average and standard deviations for each landmark. We did this for Europe and N. America and plots of alpha(opt) vs landmark for landmarks within 500km of each other are shown below in plots from the spreadsheet. For Europe it is seen that landmarks on the periphery such as the UK and Poland have larger values of Alpha. Possibly this is since there is meandering on long distance links.
| |
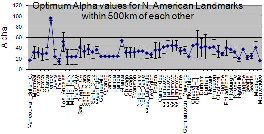
We are still investigating the abive still investigating this observation against the Intra-State connectivity in North America and through other statistical analysis.
...