...
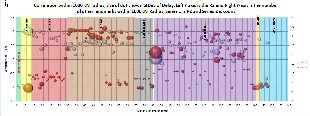
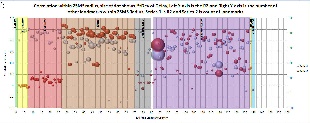
In our analysis first we calculated the correlation coefficient for all landmarks within 1000 KM and 25 MS radii of each landmark. We have also calculate the standard deviation for each landmark and number of other other landmarks within that radii. Below are the two graphs:
Plot within 1000 KM Distance Radius | Plot within 25 MS Delay Radius |
|---|---|
| |
| |
|