...
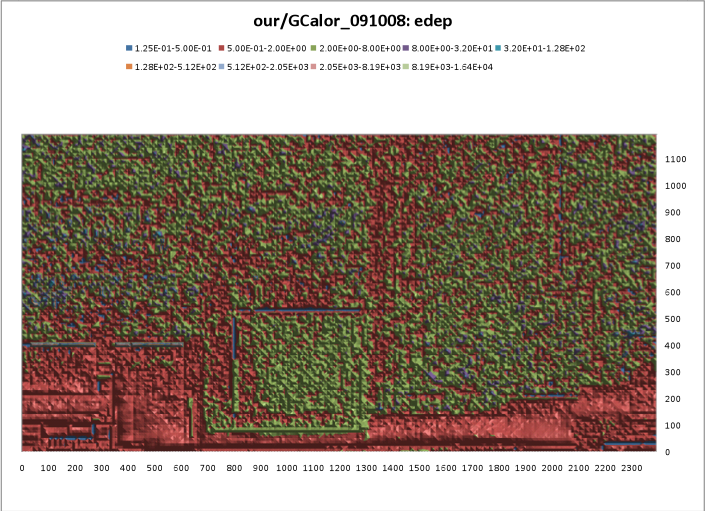
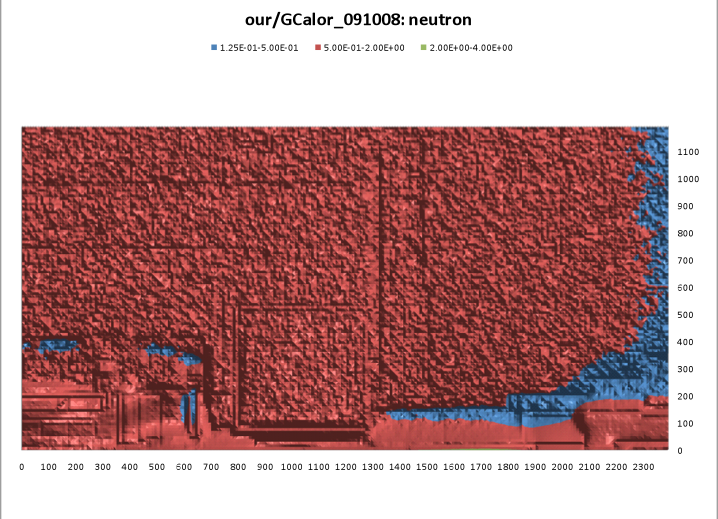
We used the same geometry, materials, etc as in this report, and compare our FLUGG results with the G3/GCALOR results from the RBTF. This is done by plotting the ratio of calculated quantities as a color map in (z,r) plots. Here are two examples for energy deposition and neutron respectively from 2009.
The differences between our results and RBTF results are now resolved. However, we will not post the new comparison plots since a uniform color is very boring! The agreement between FLUGG and G3/GCALOR is good, and the new application has been validated.
...

