...
Information on Calculation MOS can be found [here|http://www.slac.stanford.edu/comp/net/wan-mon/tutorial.html#mos].
TCP throughput from CERN & SLAC to World Regions
| | |
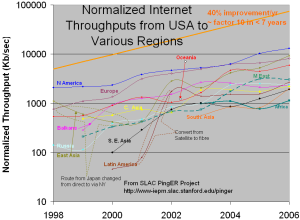
Throughput trends as | TCP throughput as seen | Normalized Internet throughput |
|---|
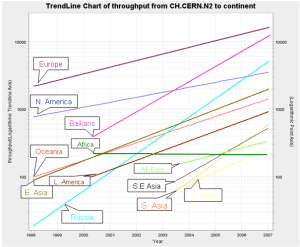
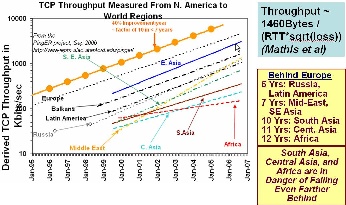
The graphs above show the derived TCP throughput using the Mathis formula. The macroscopic behavior of the TCP congestion avoidance algorithm by Mathis, Semke, Mahdavi & Ott in Computer Communication Review, 27(3), July 1997, provides a short and useful formula for the upper bound on the transfer rate:
Rate <= (MSS/RTT)*(1 / sqrt(p))
where:
Rate: is the TCP transfer rate or throughput
MSS: is the maximum segment size (fixed for each Internet path, typically 1460 bytes)
RTT: is the round trip time (as measured by TCP)
p: is the packet loss rate.
In the two graphs on the left - TCP throughput trends as seen from the US and CERN - the data points (average throughput per month) are fitted to exponential functions and for simplicity the trend lines only are shown. These lines enable us to see that East Asia is (approximately) 3 years behind Europe and is catching up, Russia and Latin America are 6 years behind Europe, the Mid-East and SE Asia are 7 years behind, and S. Asia, C. Asia and Africa are 10 years or more behind. Variation in results as observed from the US and CERN are due to the different monitoring sites. Also, our coverage in terms of monitoring sites is significantly greater as compared to that of CERN.
The figure - Normalized Internet throughput at seen from the US - shows the yearly average derived TCP throughput normalized by the minimum RTT for the region (to reduce the proximity effects). It should be noted that that the throughputs are not exponential straight lines, instead they step up (or down) as major changes are made (or occur) in the routing and circuits. For example for East Asia. there was a drop in the throughput in 2000 as a consequence of route changes from direct to via New York.
It is important to look at the aggregated statistics mentioned above in the light of International bandwidth possessed by the East Asian countries as shown below.
International Bandwidth for East Asia
The international bandwidth and Internet Penetration for China, Japan, North Korea, South Korea, Mongolia and Taiwan are shown in the figure - International bandwidth - below. The statistics have been collected from Mike Jenson 10/18/07 - International bandwidth by country, Internet World Stats and ITU. These statistics clearly show two groups of countries; those which have significant Internet penetration and those which are lagging far behind.
| | | |
International Bandwidth | Internet Penetration | Central project of the | International bandwidth |
|---|


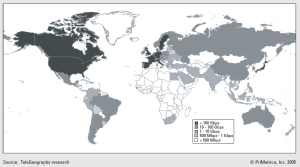
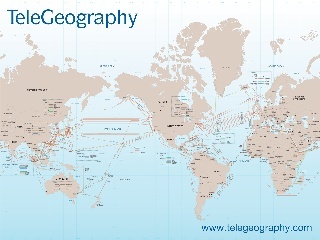
The central projection of the Global Internet Map 2006 shows the international internet bandwidth and is scaled by capacity. The map also shows country code top level internet domains (ccTLDs) and country dialing codes on color-coded tags, indicating the number of internet hosts per 10,000 people. Each country is color-coded according to the extent of international internet bandwidth available. The maps of central projection and international bandwidth usage per country were prepared by TeleGeography.
Routing
The trace route results show that generally China is directly connected with its neighbouring countries. The exceptional cases are that of the links with Vietnam and Thailand. In case of Vietnam, the traffic is routed via United Kingdom and Hong Kong, where as in case of Thailand, the traffic flows either via Hong Kong and Japan or directly.
...
Korea to Korea: Direct
Korea to China: Korea -> United States->Hong Kong OR Korea -> China
Korea to Thailand: Korea ->United States (Colorado -> Canada (Quebec) ->Thailand
Korea to Singapore: Korea -> United States(Colorado) -> Singapore
Korea to Japan: Korea -> Japan
Korea to Philippines: Korea -> Germany->Hong Kong->Philippines
Korea to Vietnam: Korea -> United Kingdom-> Hong Kong -> Vietnam
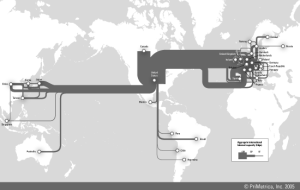
The figure below shows major international traffic routes with at least 9 Gbps of aggregate capacity. Domestic routes are omitted. The source is TeleGeography research.
| |
International routes, | Submarine cable map |
|---|
Comparison with Human Development Indices
...