...
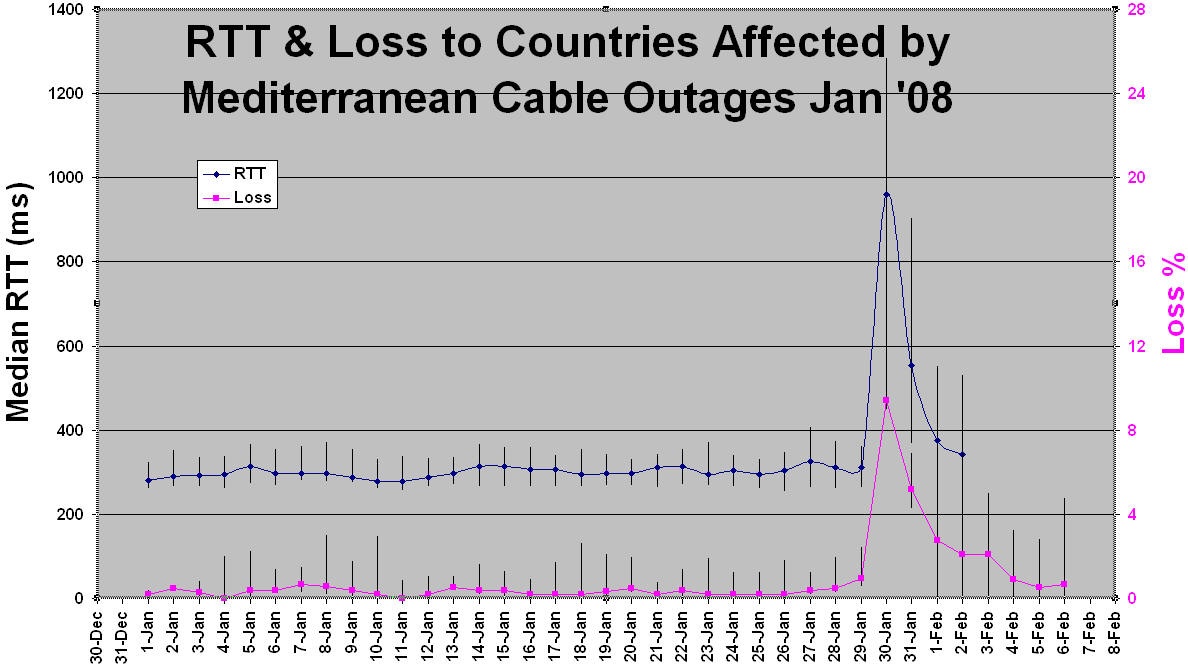
To better illustrate the recovery for the 30 hosts in 16 countries, in the Figure below we show the median RTT and Loss seen from SLAC to these hosts for the last week in Januaryaround this time. The sharp increase in RTT & Loss on January 30th is immediately obvious. It partially recovers on January 31st to about 550 ms and continues to improve for the next few days. The error bars show the variability of the results (as the Inter Quartile Range), which is seen to increase dramatically after January 29th.
To illustrate that the effects are also seen from elsewhere than SLAC in California, in the Figure below we show time series of the average RTT seen from the International Center for Theoretical Physics (ICTP) in Trieste Italy to a few of the hosts in some of the affected countries. It is not clear that the Pakistani host's increase in RTT was an effect of the outage or just normal variation (see Jan-18 and 19 for this host), it is therefore not included in the median shown. It also appears that Sudan recovered after 3 days while India was still recovering after 6 days, and there is no evidence that the Bangladesh host was recovering at all. The close tracking of the curves for both Indian hosts suggests they were using similar providers and routing.
...
