...
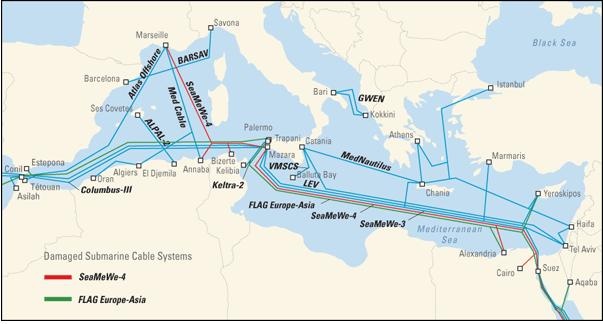
On January 31st, 2008, the NY Times, BBC, The Guardian, CNN and many others reported undersea cable cuts in the Mediterranean. One was damaged near Alexandria, Egypt, and another in the waters off Marseille, France. The two cables were damaged within hours of each other on Wednesday morning of January 30th 2008. Operators believe the damage was caused by ship's anchors during a heavy storm at sea. One of the cables, Sea Me We 4, is owned by 16 telecommunications companies along its route. The second cable, known as the Flag (for Fiber-optic Link Around the Globe) System, runs from Britain to Japan. The cables are separately managed and operated. The outages mainly affected the Middle East and Asia. Most disrupted communications were quickly rerouted through the remaining SEAMEW3 cable or fibres taking the other way around the globe. The cables involved are shown in the Telegeography map below. There are also world maps from Telegeography and Alcatel.
 !telegeography.jpg!150 countries of the world
We decided to look at the impact on Internet connectivity as seen by the PingER project measurements seen from SLAC (near San Francisco in California). These are very simple ping echo measurements of Round Trip Time (RTT), Loss, jitter etc. the variations for a given path are typically caused by congestion. The measurements provide a sample of the Internet connectivity to over 150 countries of the world, countries that between them contain over 95% of the world's population and 99% of the world's Internet connected population.
...
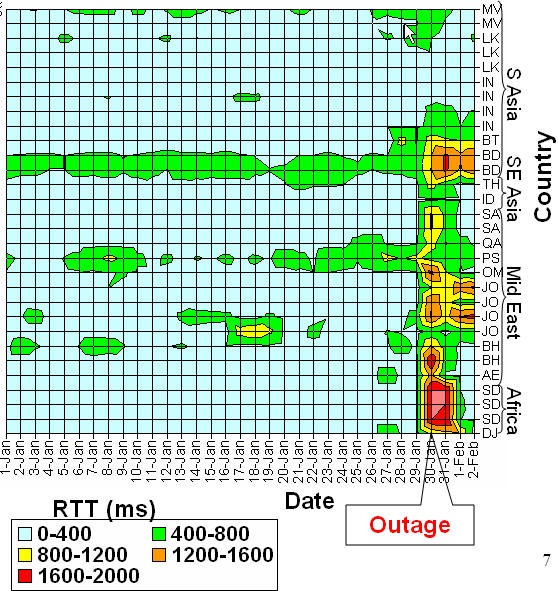
One can also see the effect by looking at the RTTs for affected hosts as a function of time. This is seen below where we plot the daily RTT seen from SLAC versus the date and the Top Level Domain (TLD) of the country the host is located in. It is seen taht there is a big spike going from around 300 ms to over 1000 ms for January 30th, followed by recovery in several cases. The main countries affected are the United Arab Emirates (AE), Bahrain (BH), Bangladesh (BD), Bhutan (BT), Djibouti (DJ), India (IN), Indonesia (ID), Jordan (JO), Sri Lanka (LK), the Maldives (MV), Oman (OM), Qatar(QA), Palestine(PS), Saudia Arabia (SA), Sudan (SD), and Thailand (TH). This is less than 5% of the total hosts monitored worldwide.
To better illustrate the recovery for the 30 hosts in 16 countries, in the Figure below we show the median RTT and Loss seen from SLAC to these hosts for the last week in Januaryaround this time. The sharp increase in RTT & Loss on January 30th is immediately obvious. It partially recovers on January 31st to about 550 ms and continues to improve for the next few days. The error bars show the variability of the results (as the Inter Quartile Range), which is seen to increase dramatically after January 29th. 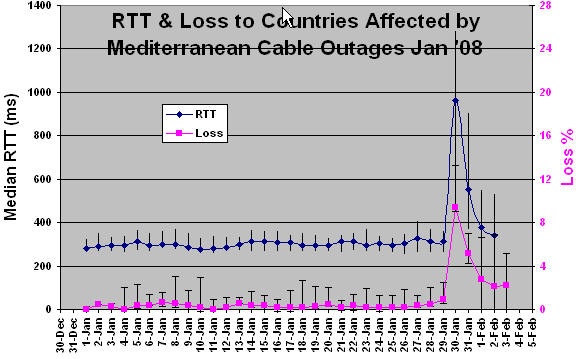
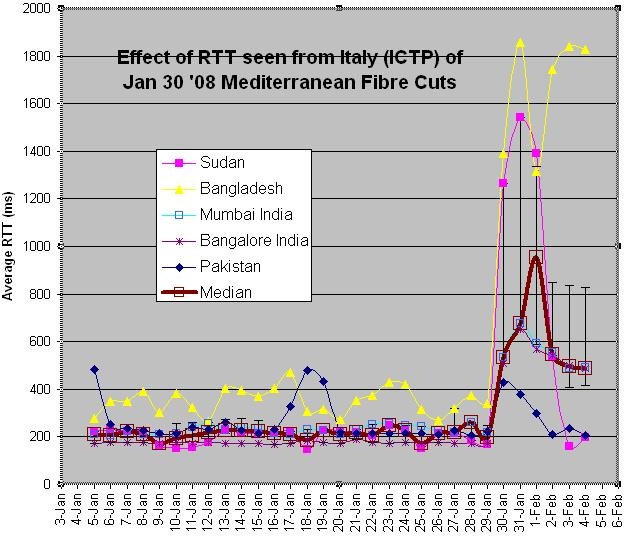
To illustrate that the effects are also seen from elsewhere than SLAC in California, in the Figure below we show time series of the average RTT seen from the International Center for Theoretical Physics (ICTP) in Trieste Italy to a few of the hosts in some of the affected countries. It is not clear that the Pakistani host's increase in RTT was an effect of the outage or just normal variation (see Jan-18 and 19 for this host), it is therefore not included in the median shown. It also appears that Sudan recovered after 3 days while India was still recovering after 6 days, and there is no evidence that the Bangladesh host was recovering at all.
It also needs to be stressed that not all hosts in all countries were impacted, e.g. India: 2 of 8; Sri Lanka 3 of 5; Malvinas 3 of 5; Indonesia 1 of 7; Turkey: 1 of 3; Thailand 1 of 6. On the other hand all monitored hosts were impacted in: UAE(1), Bangladesh(2), Bahrain(2), Djibouti(1), Jordan(4), Oman(1), Qatar(1), Saudi Arabia(2). The numbers in parentheses are the number of hosts monitored. The list of countries in this region that have PingER monitored hosts, but none of the monitored hosts were noticeably impacted is also interesting. It includes: Egypt, Ethiopia, Iran, Israel, Lebanon, Pakistan, Palestine, Sudan, Central Asia, the Caucasus and East Asia. Some of these were lucky that they did not make major use of either of the two cables (e.g. Palestine is mainly served by SEAMEWE3), others had totally different routes from SLAC (e.g. via the Pacific for East Asia), others such as Israel had other alternate paths, other used satellite (e.g. Central Asia). We also did not observe complete loss of connectivity, associated with the outage, for any host.
Looking in more detail at the impact hour by hour on January 30th we get the map on the right in the Figure below. It shows the hourly average RTTs (z axis) by time of day (y axis) on January the 30th from SLAC to 30 impacted hosts (x axis) in 17 countries identified by their Top Level Domain (TLD). In this graph the vertical (Average RTT) is chopped off at 2 seconds, though some hosts took up to almost 10 seconds to respond at times. It can be seen that the impact (sudden increase in RTT) is very abrupt. The time of the impact varies by 2-3 hours (between 4am and 7am). Most hosts continued to respond apart from 3 in Sudan and 1 in Bahrain, each of which did not respond for up to an hour. The magnitude of the impact also varies by more than an order of magnitude from country to country. By looking at the data for other days in particular Jan 29th (see the map in the left of the Figure below), we verified that the sudden increase was not caused by the normal diurnal variations of people coming to and leaving work etc.
...