...
We decided to look at the impact on Internet connectivity as seen by the PingER project measurements seen from SLAC (near San Francisco in California). These are very simple ping echo measurements of Round Trip Time (RTT), Loss, jitter etc. the variations for a given path are typically caused by congestion.
Looking at the hourly ping losses (there are ~20 pings in an hour, so a loss of 1 ping is 5% loss) seen from SLAC for January 30th 2008 for large increases in losses which persisted to the end of the day (to avoid regular diurnal change, but unfortunately missing cases where the effect was removed by the end of the day, e.g. by re-routing), the main effects seen are shown in Table 1. In Table 1, the Loss before is the average loss before the outage, the Loss after is the loss after the outage started. The Sites affected is the number of sites monitored in the country that observed an effect, the total is the total number of sites monitored in the country. It is interesting that in many cases not all hosts were affected. This may be due to use of different carriers. The impact of such losses can make many applications unusable.
...
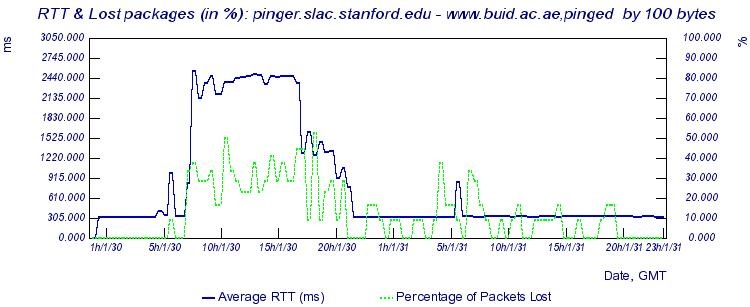
Looking further into data by PingER we can estimate the approximate start time for this event. The exact time is a bit harder to explain but it is generally between 5 AM and 7 AM GMT on January 30th 2008 for most of the countries in table 1 with the only exception of Bahrain where it all started at 9AM. The differences might be due to the measurement sampling rate or monitoring host clock synchronization issuesthe lack of load to cause congestion until people came to work later.
PingER calculates the throughput of different nodes from the Round Trip Time (RTT) and loss using the Mathis formula. It is interesting to see the effect on throughput of the regions suffered from fibre outage. Below is the table which gives us insight on the throughput of countries affected by this outage.
...
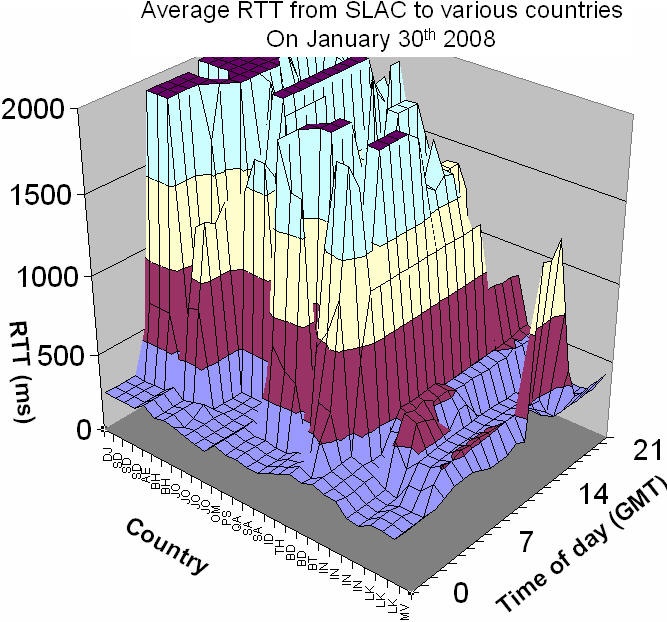
Looking in more detail at the impact hoiur by hour on January 30th we get the Figure below. IT shows the hourly average RTTs on January the 20th from SLAC to 30 impacted hosts in 17 countries. In this graph the vertical (Average RTT) is chopped off at 2 seconds, though some hosts took up to almost 10 seconds to respond at times. It can be seen that the impact (sudden increase in RTT) is very abrupt. The time of the impact varies by 2-3 hours. Most hosts continued to respond apart from 3 in Sudan and 1 in Bahrain, each of which did not respond for up to an hour. The magnitude of the impact also varies by more than an order of magnitude from country to country.
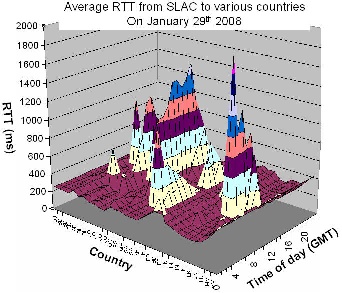
By looking at the data for other days in particular Jan 29th, we verified that the sudden increase was not caused by the normal diurnal variations of people coming to and leaving work etc.