...
We decided to look at the impact on Internet connectivity as seen by the PingER project measurements seen from SLAC (near San Francisco in California).
Looking at the hourly ping losses (there are ~20 pings in an hour, so a loss of 1 ping is 5% loss) seen from SLAC for January 30th 2008 for large increases in losses which persisted to the end of the day (to avoid regular diurnal change, but unfortunately missing cases where the effect was removed by the end of the day, e.g. by re-routing), the main effects seen are shown in Table 1. In Table 1, the Loss before is the average loss before the outage, the Loss after is the loss after the outage started. The Sites affected is the number of sites monitored in the country that observed an effect, the total is the total number of sites monitored in the country. It is interesting that in many cases not all hosts were affected. This may be due to use of different carriers. The impact of such losses can make many applications unusable.
...
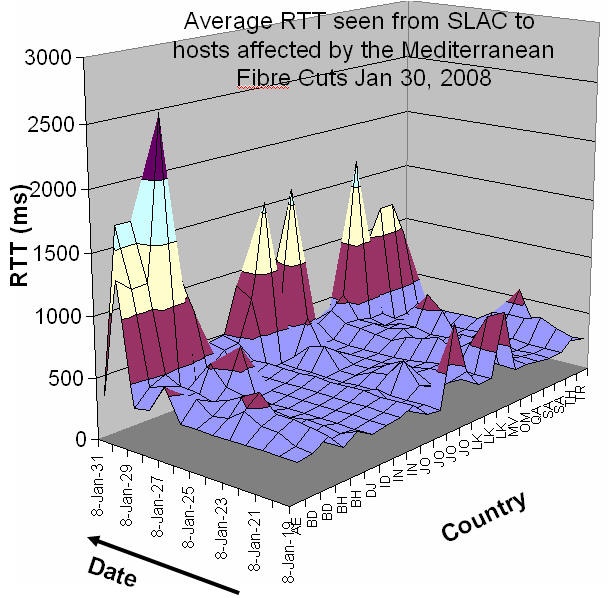
One can also see the effect by looking at the RTTs for affected hosts as a function of time. This is seen below where we plot the daily RTT seen from SLAC versus the date and the Top Level Domain (TLD) of the country the host is located in. It is seen taht there is a big spike going from around 300 ms to over 1000 ms for January 30th, followed by recovery in several cases. The main countries affected are the United Arab Emirates (AE), Bangladesh (BD), Bhutan (BH), Djibouti (DJ), Indonesia (IN), Jordan (JO), Sri Lanka (LK), the Maldives (MV), Oman (OM), Saudia Arabia (SA), Thailand (TH) and Turkey (TR).
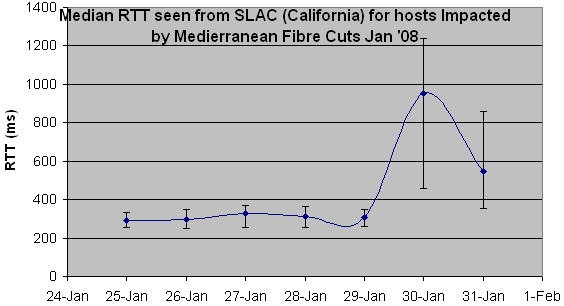
To better illustrate the recovery for these 23 hosts in 13 countries, in the Figure below we show the median RTT seen from SLAC to these hosts for the last week in January. It is seen that the median RTT goes from a very stable ~300ms to almost 1000ms (a factor of more than 3) on January 30th. It partially recovers on January 31st to about 550 ms. The error bars show the variability of the results (as the Inter Quartile Range), which is seen to increase dramatically after January 29th.