...
The above table shows the average of throughput before and after the start of the fibre outage. The results clearly show order of magnitude reductions in throughput.
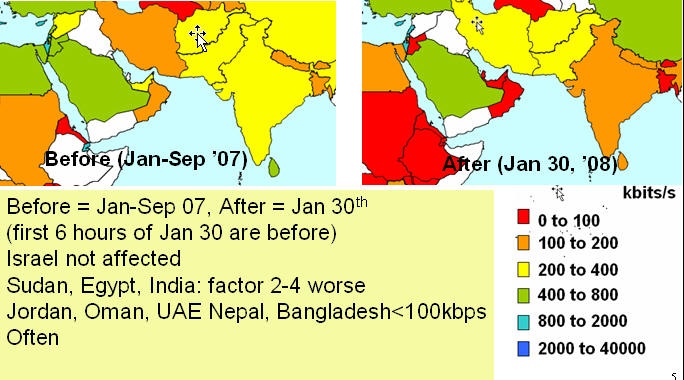
Another view of the changes is seen in the map below showing the throughputs before (Jan-Sep 2007) and after (Jan 30 2008).