...
See the note below about the general system test job options.
It The AllGammaOverlay test produces the same output histograms as AllGamma for now. Probably some things should be added. My short list is below.
...
One thing I am trying to confirm is that the overlay test is working properly and as desired. For example, is it okay to run these with ideal calibrations? Seems like, yes. Any other configuration issues?
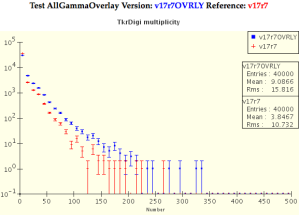
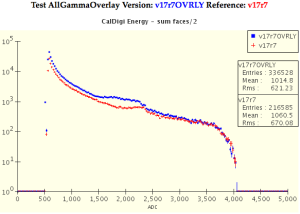
In general, there are more digis and less 0's for all the subsystems. This evolves a bit with the later GR versions. Energy features are shifted a bit higher in some distributions. More There are more triggers and more vetoes. These are not surprises. Examples below.
...
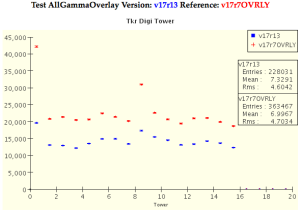
You may have already guessed... these are hot tracker strips in the PT (periodic trigger) events. I believe the most recent overlay events are selected over the full precession period (~55 days) and the selected period started close to the beginning of science opsThe selected periodic trigger events must be taken from before some of the hot strip mask updates were made. See this presentation on Tracker Status at the September 2008 collaboration meeting. The two layers outside specification at that time were Tower 0 X7 (32 strips) and Tower 8 X17.
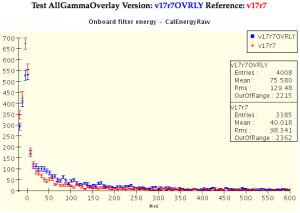
comparison of two overlay versions |
|
|
comparison with no overlay |
|
|


| Anchor | ||||
|---|---|---|---|---|
|
Some plots from the initial comparison of GR v17r7 with and without overlays turned on.


I also ran the initial test for GRv17r10 GR v17r10 v17r12, v17r13, v17r15...
The overall level of digis is reduced for all of these compared to v17r7. I think most of this should be because of the updates to exclude sub-threshold ACD tiles for PT events.
...