...
Note that you must be careful about the number of workers you select (in the PyTorch trainer object) which should be <= the number of CPU cores you're using (using more CPU cores parallelizes the data loading,
which can be the primary bottleneck in training). The number of requested GPUs should match the number of devices used in the training.
For training on slurm
Change the submit_slurm.sh script as follows
| Code Block | ||
|---|---|---|
| ||
#SBATCH --output="<your_output_path>/out/slurm-%j.%x.out"
#SBATCH --error="<your_output_path>/out/slurm-%j.%x.err

export COMET_API_KEY=<your_commet_key>
export COMET_WORKSPACE=<your_commet_workspace>
export COMET_PROJECT_NAME=<your_project_name>

cd <your_path_to_salt_directory> |
Submitting a job to slurm
from top level salt directory can use following command to launch a slurm training job in sdf
| Code Block | ||
|---|---|---|
| ||
sbatch salt/submit_slurm_bjr.sh |
Both slurm-%j.%x.err andslurm-%j.%x.out files will start to fill up
You can use standard sbatch commands from SDF documentation to understand the state of your job.
Comet Training Visualization
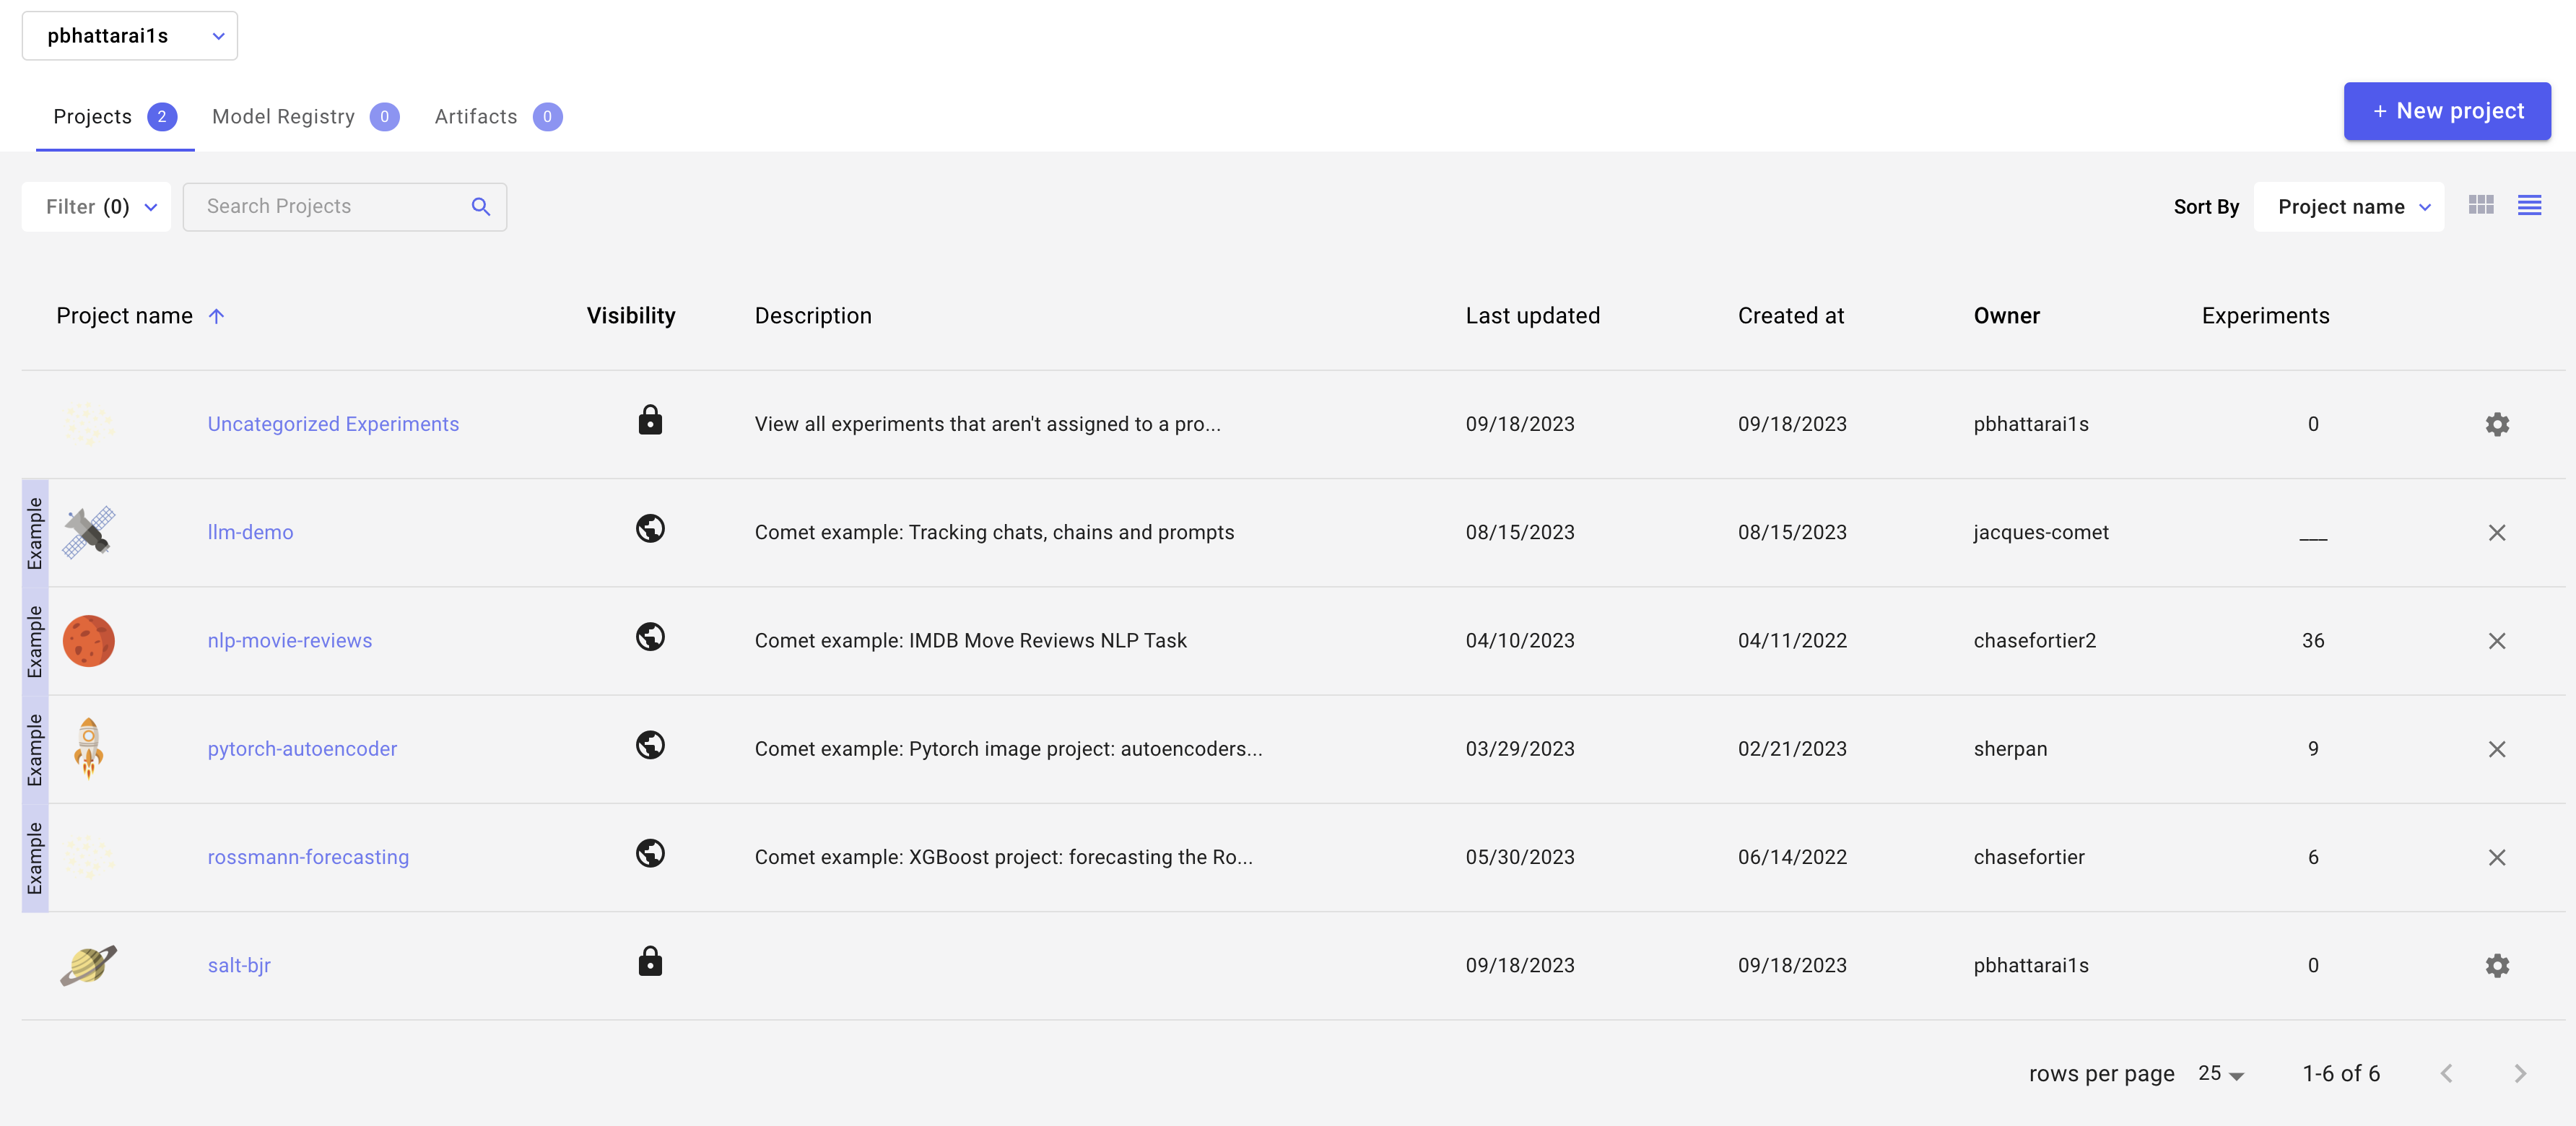
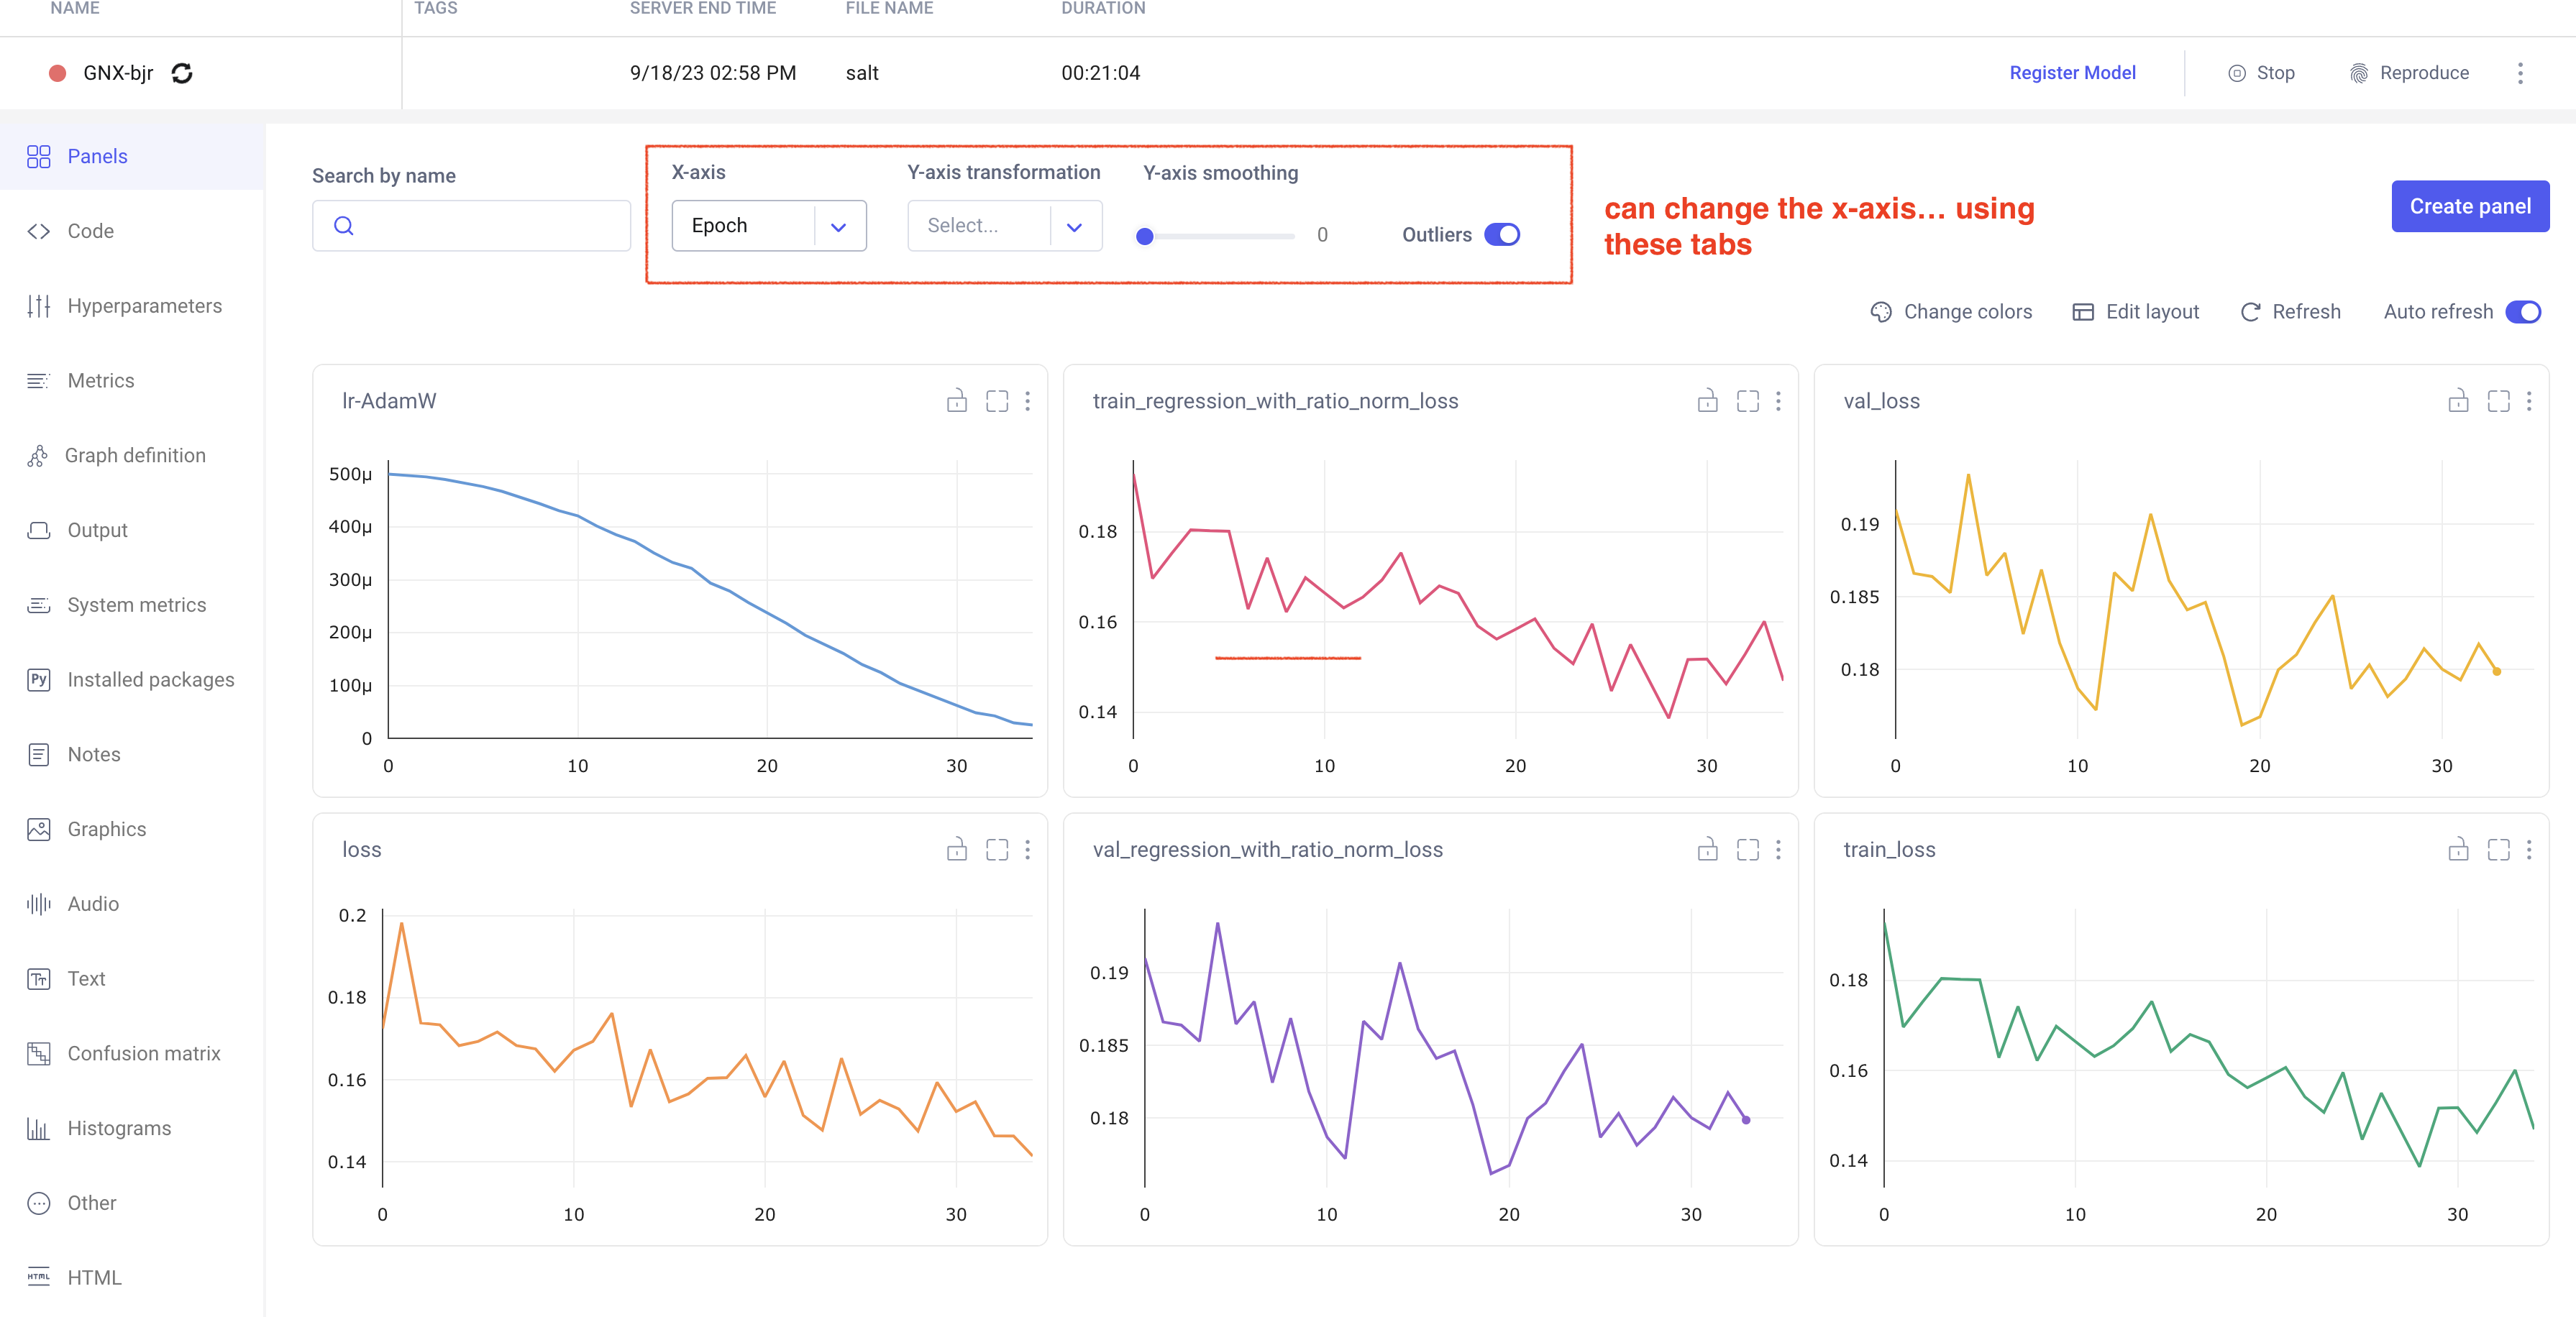
In your comet profile, you should start seeing the live update for the training which looks as follows. The project name you have specified in the submit script appears under your workspace which you can click to get the graphs of live training updates.
Training Evaluation
Follow salt documentation to run the evaluation of the trained model in the test dataset. This can also be done using a batch system. I (Prajita) personally have a separate bash script similar to the training script, for evaluating the training. The script looks like the following.
| Code Block | ||
|---|---|---|
| ||
#!/bin/bash

# Job name
#SBATCH --job-name=salt-bjr

# choose the GPU queue
#SBATCH -p usatlas
# #SBATCH -p shared

# requesting one node
#SBATCH --nodes=1
#SBATCH --exclusive

# keep environment variables
#SBATCH --export=ALL

# requesting 4 V100 GPU
# (remove the "v100:" if you don't care what GPU)
# #SBATCH --gres=gpu:v100:4
#SBATCH --gpus=1

# note! this needs to match --trainer.devices!
#SBATCH --ntasks-per-node=1

# number of cpus per task
# useful if you don't have exclusive access to the node
#SBATCH --cpus-per-task=22

# request enough memory
#SBATCH --mem=200G

#CHANGE HERE log names; %j gives job id, %x gives job name
#SBATCH --output=<path_to_where_you_want_to_store_evaluate_output>slurm-%j.%x.out
#SBATCH --error=<path_to_where_you_want_to_store_evaluate_output>slurm-%j.%x.err


# speedup
export OMP_NUM_THREADS=1

echo "CPU count: $(cat /proc/cpuinfo | awk '/^processor/{print $3}' | tail -1)"

echo "Current node: ${SLURMD_NODENAME}"

# CHANGE THIS :: move to workdir
cd <path_to_your_salt_dir>
echo "Moved dir, now in: ${PWD}"

# activate environment
source /sdf/group/atlas/sw/conda/etc/profile.d/conda.sh
#setup_conda
conda activate salt
echo "Activated environment ${CONDA_DEFAULT_ENV}"
echo "CUDA_VISIBLE_DEVICES: $CUDA_VISIBLE_DEVICES"

# evaluate the training
echo "Evaluating the trained model on test sample..."
srun salt test --config <your_path_to>/logs/GNX-bjr_20230918-T120112/config.yaml --data.test_file <your_path_to_test_file> --data.num_workers 20 |
This produces a log in the same directory as all the log files, which can be read/compared using h5.
To do: add a link to a simple notebook that analyzes the evaluation file.
Training Optimization
Miscellaneous tips
You can grant read/write access for GPFS data folder directories to ATLAS group members via the following (note that this does not work for SDF home folder)
...