...
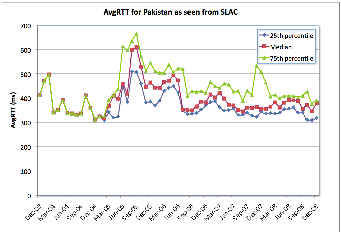
As seen in figure 6 the average RTT shows that the estimates have dropped gradually from poor (about 600 ms) to acceptable (about 350 ms). While the internet penetration was increasing in 2005, a significant increase was observed around Septermber September 2005 when the undersea cables were severed. The average RTT remained steady around 450ms untill 2006 when Pakistan acquired additional international bandwidth by via three undersea fibre links due to which we observe a drop in July 2006. Pakistan has been gradually acquiring additional bandwidth as the demand increases. As also confirmed from the routing results, Pakistan maintains at least four different routes to the world.
Studying the measurements to individual universities and commercial organizations within Pakistan as shown in Figures 7 and 10, we see that nearly all the institutions have either maintained their performance i.e. measurements of less than 400ms or have improved relatively over time. Except for GIKI which has been performaing performing poorly since early 2008.
Figure 6 | Figure 7 | Figure 8 | Figure 9 |
|---|---|---|---|
| | | |
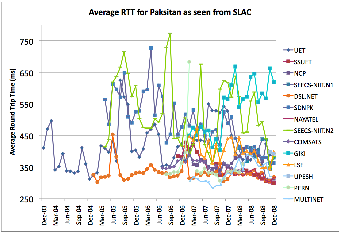
The round trip times to Pakistan have generally improved due to change of international routes, however the connectivity to the institutions has not improved in similar proportions. This is evident from the last mile effects observed in Figures 12 and 13. The increase in RTT as well as Packet Loss during the day - when people use Internet resources - is evident for all institutions except NAYATEL which is an Internet Service Provider. We identified these effects in 2006, and informal recommendations were forwarded to the concerned institutions as well as the Higher Education Commission of Pakistan. We see that SEECS-NUST has significantly improved its performance over the years, however, it still faces issues of congestion due to the last-mile effect (in other words, insufficient available bandwidth per person consdering considering the usage at a university).
...
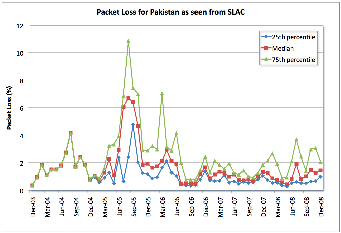
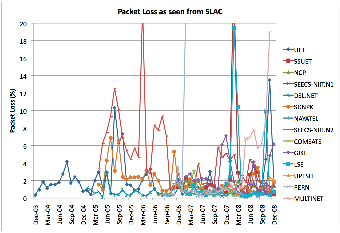
In a similar pattern, we see improvements in Packet Loss estimates as shown in Figure 8. As discussed earlier regarding Figure 7, we see improments improvements in Packet Loss estimates in Figure 9 for nearly all the institutions except GIKI which shows increased losses. However we see in Figure 9 and 11 thatdespite that despite the improvements the packet loss estimates are not within acceptable levels. Except for SEECS-NUST , NCP-Quaid-e-Azam University, Micronet/Nayatel and PERN, all the other institutions show packet loss levels greater than 1%.
...
The fundamental observation made from this case study is that though the national backbone is well provisioned, yet the institutions do not reflect the expected levels of performance. The primary reason for this is the poor high user to available bandwidth ratio. Also, the power shortage in Pakistan does not help with unreachability levels.
...