...
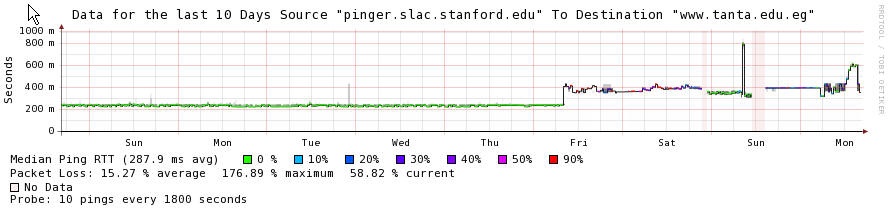
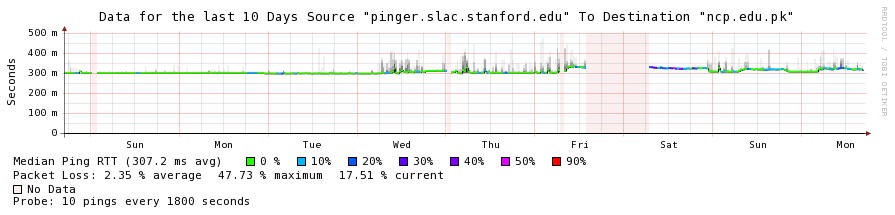
Examples of the increase in RTT can be seen below in the plot of RTT seen from SLAC to a host in Egypt, a host at the Lahore School of Economic, Pakistan and a host at the NCP provider in Pakistan. All show an increase in RTT around 9-10am on Friday Dec 19th 2009 (UDT). In the case of Egypt no loss of connectivity was observed at the time of the cut. In the case of Lahore there was a short period of no connectivity and over the days of the outage the RTT varied dramatically. In fact by Saturday for Lahore the losses dropped back to a more normal. NCP had a small increase in RTT and a long period of no connectivity later on Friday stretching into Saturday. These graphs illustrate the variability of bthe the impact even within a country.

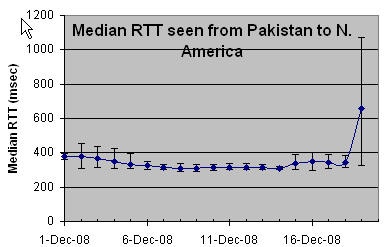
Another view of the effect of the RTT increases is seen in the plot below of the median RTTs measured (thed error bars are the 25% and 75%-tiles) from 3 monitoring hosts in Pakistan (NUST, COMSATS and NCP) to FNAL and SLAC (i.e. 6 pairs of monitor/remote hosts) for the first 19 days of December 2008.
...