...
An example of the increase in RTT can be seen below in the plot of RTT seen from SLAC to a node in Egypt. The sudden change in RTT from ~ 244ms to almost 400ms can be seen around 9-10am on Friday Dec 19th 2009 (UDT). 
Another view of the effect of the RTT increases is seen in the plot below of the median RTTs measured (thed error bars are the 25% and 75%-tiles) from 3 monitoring hosts in Pakistan (NUST, COMSATS and NCP) to FNAL and SLAC (i.e. 6 pairs of monitor/remote hosts) for the first 19 days of December 2008. 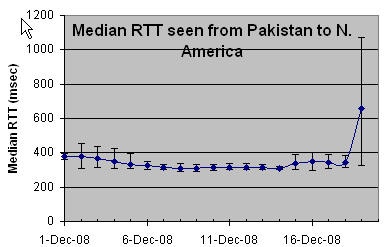
...