...
The measured effects on the losses seen from N. America (SLAC in California) to hosts in N. Africa (Egypt, Sudan); Middle East (Bahrein, Palestine, UAE, Oman, Jordan, Lebanon, Saudia Arabia); S. Asia (Sri Lanka, Maldives, Pakistan) are huge. As seen from PingER daily loss data measured from SLAC, comparing the losses on Friday Dec 19 with those on Mon-Thu (15-18 Dec) the losses have increased by a factor of 5 to 30 times for most of the hosts monitored in the above countries.
Unreachability
...
Round Trip Time (RTT)
...
Round Trip Time (RTT)
An example of the increase in RTT can be seen below in the plot of RTT seen from SLAC to a node in Egypt. The sudden change in RTT from ~ 244ms to almost 400ms can be seen around 9-10am on Friday Dec 19th 2009. 
Another view of the effect of the RTT increases is seen in the plot below of the median RTTs measured (thed error bars are the 25% and 75%-tiles) from 3 monitoring hosts in Pakistan (NUST, COMSATS and NCP) to FNAL and SLAC (i.e. 6 pairs of monitor/remote hosts) for the first 19 days of December 2008. 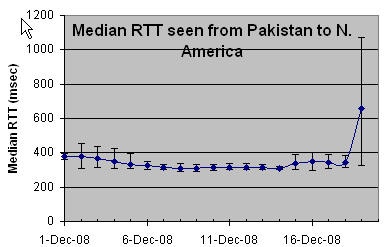
...
We derive the throughput from the loss and RTT measurements as decribed described elsewhere. We then calculate the impact as: Residual_Bandwidth_Fraction
| Panel |
|---|
Impact Residual_Bandwidth_Fraction = median(derived_throughput for Dec 19-20) / median(derived_throughput for Dec 1-18) |
This was results were sorted by Impact Residual_Bandwidth_Fraction to create the following table of the worst affected countries:
Country Impact | Residual_Bandwidth_Fraction |
Oman | 1.89% |
Sudan | 2.79% |
Cape Verde | 3.26% |
Egypt | 3.72% |
Jordan | 4.06% |
Bahrain | 8.24% |
Sri Lanka | 19.41% |
Ethiopia | 24.03% |
Pakistan | 24.32% |
Reunion-French Colony | 26.21% |
Libya Arab Jamahiriya | 28.72% |
Bangladesh | 28.89% |
United Arab Emirates | 31.04% |
Malta | 31.28% |
...