...
An example of the increase in RTT can be seen below in the plot of RTT seen from SLAC to a node in Egypt. The sudden change in RTT from ~ 244ms to almost 400ms can be seen around 9-10am. 
Another view of the effect of the RTT increases is seen in the plot below of the median RTTs measured (thed error bars are the 25% and 75%-tiles) from 3 monitoring hosts in Pakistan (NUST, COMSATS and NCP) to FNAL and SLAC (i.e. 6 pairs of monitor/remote hosts) for the first 19 days of December 2008. 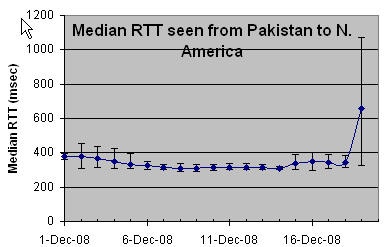
Traceroutes from SLAC to Egypt
Following the outage the routes changed dramatically and pretty often as the carriers found alternate routes. Before then cut the routes went Eastwards across the US via ESnet, then via GEANT to Egypt. Immediately following the traffic still went Eastwards but via NTT and FLAG, later it want Westwards from Palo Alto in California to Tokyo and Hong Kong using FLAG. Later still TATA picked up the route and it went via Singapore rahther thah Hong Kong.