...
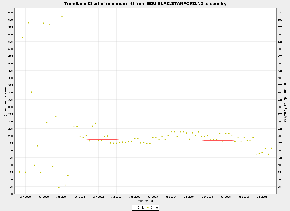
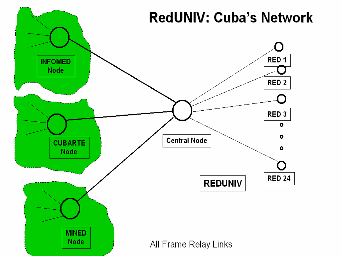
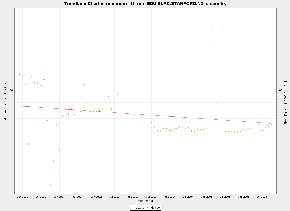
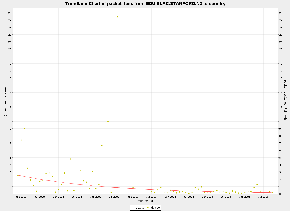
Cuba
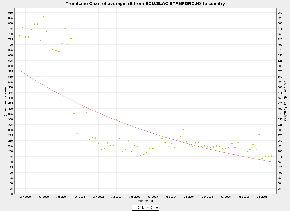
Poor performance due to satellite link. Average and min RTT are about 800ms. Packet loss is around 2-4 % in 2006
(The only hope for Cuba is to connect to RedClara) RedClara plans to connect to Cuba in the near future
Mexico
July 2003 performance improved . Minumum RTT became stable 100 ms to 60 ms and Average RTT also became stable.
but January 2005 to July 2005 again problem arose
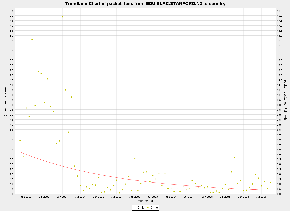
Guatemala
Janruary 2005 packet loss becomes stabilizing >1% April 2003 minimum and average RTT improved
...
There are many "development" indices today:
...
- ITU Digital Access Index (2003) and the Digital Opportunity Index (2006), both 180 countries
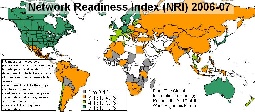
- World Economic Forum's Network Readiness Index (2004, 2005, 2006-2007: 122 countries)
- Harvard University Network Readiness Index (2002, 75 countries)
...
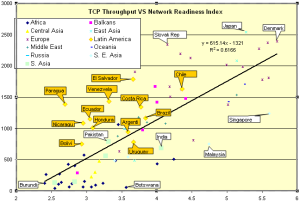
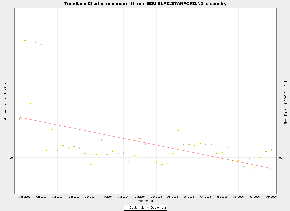
In the scatter plots below of the derived throughputs vs. the "development" index, the US, Canada and Mexico are typically excluded since the distance from the measuring point (the US) RTT is small so the derived throughput from the Mathis formula will be artificially high. Hosts in well connected countries such as Finland, Sweden, Japan also have their losses poorly measureed since only 14,400 packets are sent to a host in a month, so measuring losses of < .01% is inaccurate.
Comparison of TCP Throughput with
...
Digital Access Index
Graph Goes here
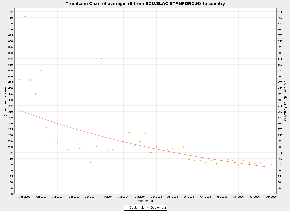
The UNDP Human Development Index (HDI) is composed of 3 factors defining the development of a country. They are:
- A Long and healthy life, as measured by expectancy at birth.
- Knowledge, as measured by the adult literacy rate (with 2/3 weight) and the combined primary, secondary and tertiary gross enrolment ratios (with 1/3 weight).
- A decent standard of living, as measured by GDP per capita.
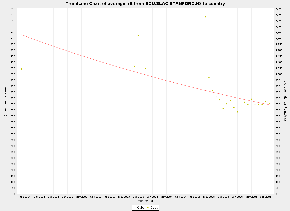
On the scatter plot the S. Asian countries are indicated by orange diamonds.
The figure above shows a scatter plot of the HDI versus the PingER Derived Throughput for July 2006. Each point is colored according to the country's region. A logarithmic fit is also shown. Logarithmic is probably appropriate since Internet performance is increasing exponentially in time and the differences between the countries can be related to number of years they are behind the developing countries, while human development is more linear. Since the PingER Derived TCP Throughput is linearly proportional to RTT, countries close to the U.S. (i.e. the U.S., Canada and Central America) may be expected to have elevated throughputs compared to their HDI. We thus do not plot or use these countries in the correlation fit between HDI and throughput. It is seen that there is a strong correlation (R2 > 0.6) between the HDI and throughput. As expected countries in Africa generally occupy the lower values in x and y, and European countries together with Australia, New Zealand, Korea and Japan occupy the higher values of x and y.
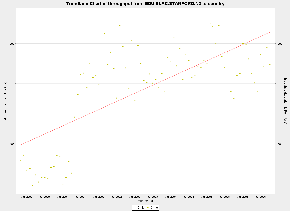
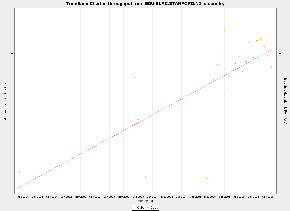
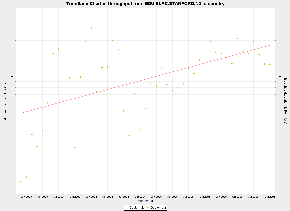
Comparison of TCP Throughput with Technology Access Index
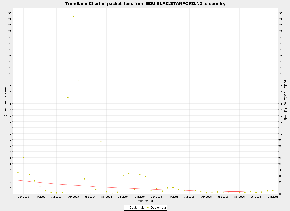
In 2001 the United Nations Development Programme (UNDP) introduced the Technology Achievement Index(TAI) with 72 countries to reflect a country's capacity to participate in the technological innovations of the network age. The TAI aims to capture how well a country is creating and diffusing technology and building a human skill base. It includes the following dimensions: Creation of technology (e.g. patents, royalty receipts); diffusion of recent innovations (Internet hosts/capita, high & medium tech exports as share of all exports); Diffusion of old innovations (log phones/capita, log of electric consumption/capita); Human skills (mean years of schooling, gross enrollment in tertiary level in science, math & engineering). the Figure below shows December 2003's derived throughput measured from the U.S. vs. the TAI. The correlation is seen to be positive and medium to good.
Graph goes over here
Comparison of TCP Throughput with Digital Access Index
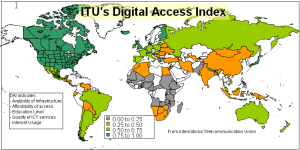
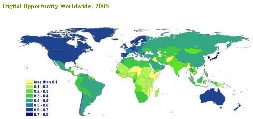
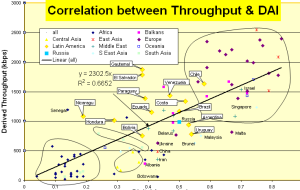
In 2003, the ITU's Market, Economics and Finance Unit launched the Digital Access Index (DAI), a new In 2003, the ITU's Market, Economics and Finance Unit launched the Digital Access Index (DAI), a new index, which measures the overall ability of individuals in a country to access and use new ICTs. The DAI is built around four fundamental vectors that impact a country's ability to access ICTs: infrastructure, affordability, knowledge and quality and actual usage of ICTs. The DAI has been calculated for ~180 economies where European countries were among the highest ranked. The DAI allows countries to see how they compare to peers and their relative strengths and weaknesses. The DAI also provides a transparent and globally measurable way of tracking progress towards improving access to ICTs." from http://www.itu.int/ITU-D/ict/dai/. In 2005 the ITU launched the Digital Opportunity Index(DOI) The DoI evaluates the opportunity, infrastructure and utilization of Information and Communication Technologies (ICTs) for 180 economies worldwide. The Index monitors the mobile communications that promise to bridge the digital divide in many parts of the world, as well as more recent technologies such as broadband and mobile Internet access.The right hand map above shows the DOI coverage and values worldwide.
...
A map of the NRI for the 122 countries of the 2006-2007 NRI are shown in the map below.