...
From SLAC: 1. Packet Loss, 2. Min RTT to World Regions, 3. Unreachability, 4. Jitter
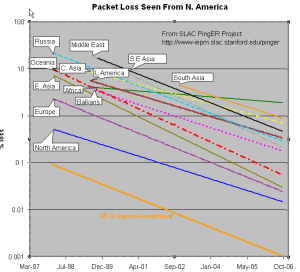

The left hand figure shows the packet loss to various regions of the world as seen from N. America. Since losses are fairly distance independent no attempt has been made to normalize the data. For typical bursty Internet loss patterns, losses of >1% will result in annoying interactive VoIP and video conferencing. It is seen that the world divides up into two major super-regions: N. America, Europe, E. Asia and Oceania with losses below 0.1%, and Latin America, C. Asia, Russia, S.E. Asia, S. Asia and Africa with losses > 0.1% and as high as as a few per-cent. All countries are improving exponentially, but Africa is falling further behind most regions.
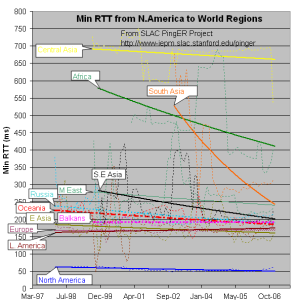
The left middle figure shows the drop in the MinimumRTTs of > 400ms result in poor real-time interactivity. The large step for S. Asia in 2003 was due to the change over from satellite to fibre. Central Asia (also Afghanistan) has hardly moved in its minimum RTT since it continues to use geostationary satellites.
...