...
The right hand graph shows the jitter or variability of world regions seen from the US. The jitter is defined as the Inter Quartile Range (IQR) of the Inter Packet Delay Variability (IPDV i = RTT i - RTT i-1) . The Jitter is relatively distance independent, it measures congestion, and has little impact on the Web and email. It decides the length of VoIP codec buffers and impacts streaming. We see the usual division into dveloped verus developing regions.
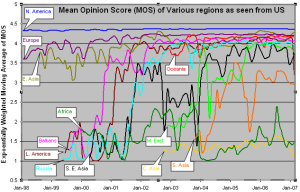
MOS for various regions
The telecommunications industry uses the Mean Opinion Score (MOS) as a voice quality metric. The values of the MOS are: 1= bad; 2=poor; 3=fair; 4=good; 5=excellent. A typical range for Voice over IP is 3.5 to 4.2 (see VoIPtroubleshooter.com). In reality, even a perfect connection is impacted by the compression algorithms of the codec, so the highest score most codecs can achieve is in the 4.2 to 4.4 range.
There are three factors that significantly impact call quality: latency, packet loss, and jitter. We calculate the jitter using the Inter Packet Delay Variability (IPDV) , see the http://www.slac.stanford.edu/comp/net/wan-mon/tutorial.html#mosTutorial.
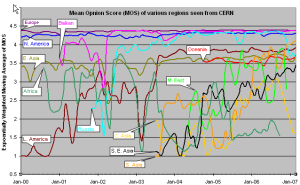
Most tool-based solutions calculate what is called an "R" value and then apply a formula to convert that to an MOS score. Then the R to MOS calculation is relatively standard. The R value score is from 0 to 100, where a higher number is better. To convert latency, loss, and jitter to MOS we follow Nessoft's method. The graphs below shows the Exponentially Weighted Moving Average (using EWMI i = alpha * EWMI i-1 + (1 - alpha) * Obs i where alpha = 0.7 and EWMI 1 = Obs 1) for the MOS as seen from the W. Coast of America (SLAC) and Switzerland (CERN). N.B. MOS values of one are reported for heavy loss (loss > 40 %).
...
| Include Page | ||||
|---|---|---|---|---|
|
Argentina
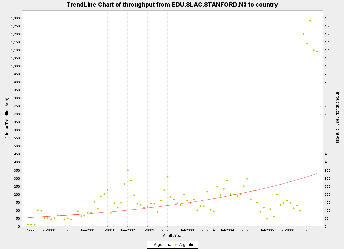
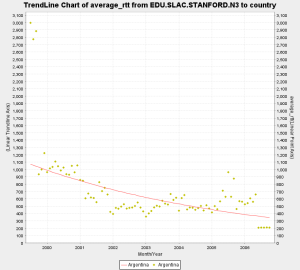
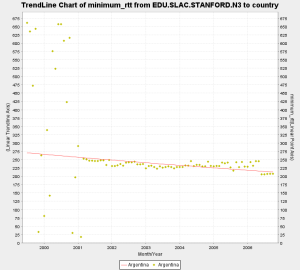
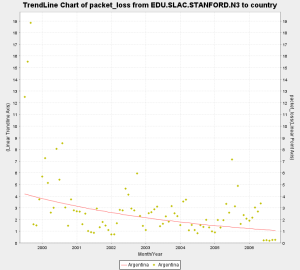
In December 2001, Argentina's (RETINA) connected to AMPATH, so the increase in performance to Argentina can be seen from SLAC. Around June 2006 the TCP throughput of Argentina increased significantly. The average RTT reduced from 600 ms to 200 ms. The minimum RTT reduced from 250 ms to 200 ms.The packet loss has also decreased significently.
...