...
Most tool-based solutions calculate what is called an "R" value and then apply a formula to convert that to an MOS score. Then the R to MOS calculation is relatively standard. The R value score is from 0 to 100, where a higher number is better. To convert latency, loss, and jitter to MOS we follow Nessoft's method. The graphs below shows the Exponentially Weighted Moving Average (using EWMI i = alpha * EWMI i-1 + (1 - alpha) * Obs i where alpha = 0.7 and EWMI 1 = Obs 1) for the MOS as seen from the W. Coast of America (SLAC) and Switzerland (CERN). N.B. MOS values of one are reported for heavy loss (loss > 40 %).
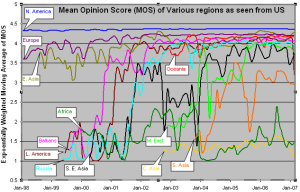
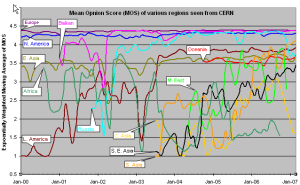
CERN monitors fewer remote hosts than SLAC (56 versus over 400) so the data is not as complete in the CERN case. Comparing the two graphs, it can be seen that, as expected, the MOS is better for the shorter distances (i.e. CERN to Europe is better than SLAC to Europe, SLAC to N. America is better than CERN to N. America.). It is also seen in both graphs that the Balkans, Russia and Latin America improved dramatically in 2000-2002. Much of Latin America and Russia moved from satellite to land lines in this period. It can be seen from the above plot that VoIP ought to be successful between SLAC and the US, Europe, E. Asia, Russia and the Mid East (all above MOS = 3.5). S. E. Asia is marginal, S. Asia people will have to be very tolerant of one another, and C. Asia and Africa are pretty much out of the question in general. In general the CERN graphs looks similar to the SLAC graph to the various regions, except that S. E. Asia is worse for CERN than SLAC as is S. Asia
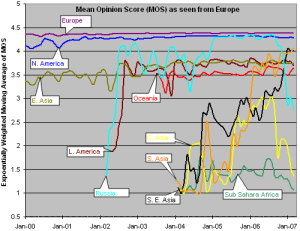
The third graph shows the Mean Opinion Score (MOS) from Europe two various regions. We have five monitoring sites in Europe (one at CERN, one at ICTP, one in Germany, and two at UK. The improvement in Latin America and Russia in 2002 is the result of shift from satellite to fiber. The drop for Russia in Sep, 2006 is because we installed a new version of PingER and it started monitoring 9 hosts in Russia whereas previously it was monitoring 20 hosts. For Central Asia the number of sites went up from 3 to 15 in Sep 2006, so the latter results are a better indication of the overall performance of Central Asia. For Sub Sahara Africa the coverage improved in Sep, 2006 (increased from 8 to 39 sites). So for sub Sahara Africa the results after Sep 2006 presents a better picture. South Asia as seen from Europe is performing better than as seen from US because MOS is derived from average RTT which is distance dependent.
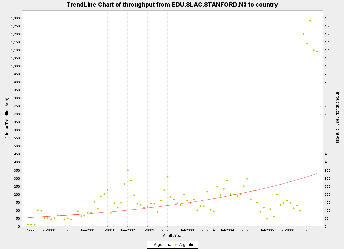
Argentina
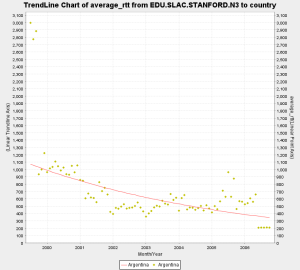
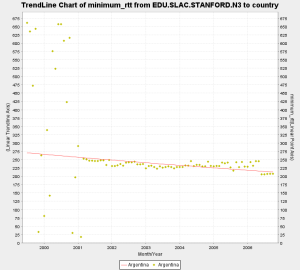
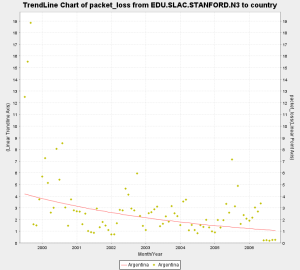
In December 2001, Argentina's (RETINA) connected to AMPATH, so the increase in performance to Argentina can be seen from SLAC. Around June 2006 the TCP throughput of Argentina increased significantly. The average RTT reduced from 600 ms to 200 ms. The minimum RTT reduced from 250 ms to 200 ms.The packet loss has also decreased significently.
...