...
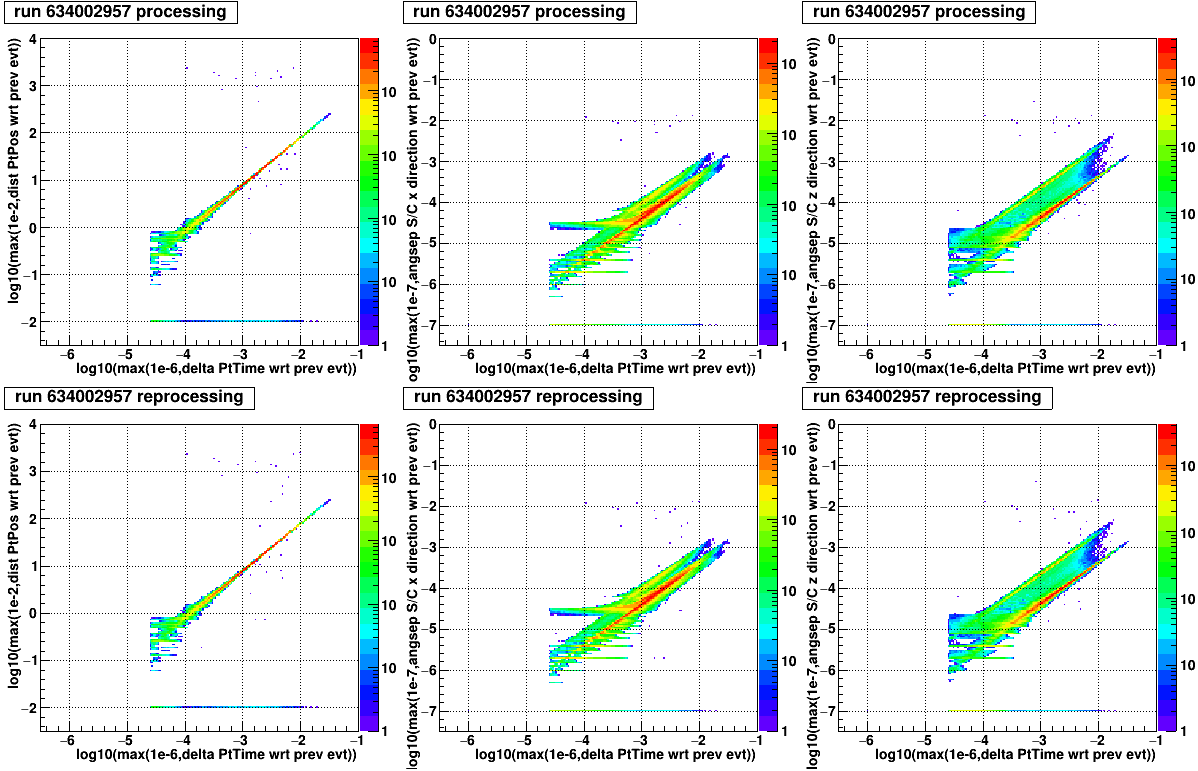
These quantities are the result of some interpolation between values computed from the FT2 file. So we expect them to change continuously with time. One way to check it is to look at the difference between 2 consecutive events w.r.t. to the delta time between these events:
| 633997253 | |
| 634002957 |
One can see:
- a "main" correlation branch, with clear sub-branches for the PtRaDec x and z directions
- some events with a difference (graph y-axis) = 0
- it occurs often that the quantity does not change during several consecutive events
- some events scattered away from the main branch ()
- they correspond to when the information goes back to normal
...
I've dumped the Merit information in a text file (for the run 634002957) with the following information:
...

