...
While the absolute values differ by orders of magnitude, the relative positions (in parentheses) are more stable. We can get a quantitative measure of the correlation between the various measurements and PingER by plotting each value against the PIngER value and calculating the R2 which is a measure of how much of the variance in y is explained by the model x (or in our case PingER). We do this for the measurements that have > data for >
The yearly timeseries is shown below for the countries
=6 data points (ASEAN nations) to compare.
| Measurement by | R2 |
|---|---|
Atlas and Boots | 0.61 |
| Speedtest | 0.47 |
| Global Economy | 0.77 |
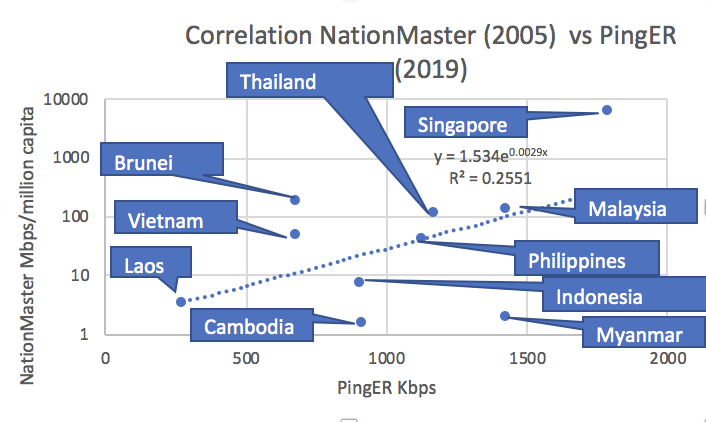
| NationMaster | 0.26 |
The yearly time series of the PingER measured derived throughputs is shown below:
...
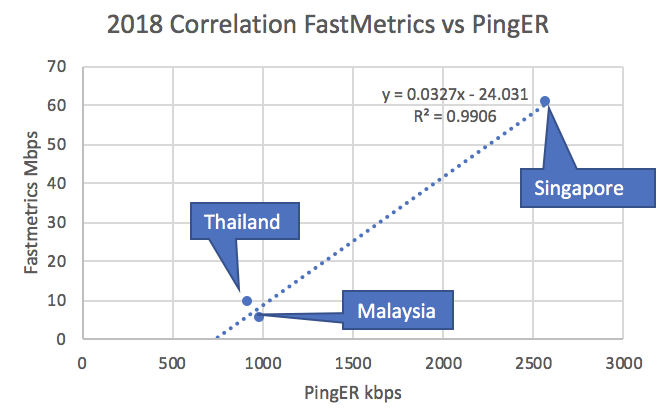
Top 50 average download speeds June 2017 - May 2018. There are only 3 ASEAN nations in FastMetrics so we do not use this data in the comparisons.
Wikipedia
2017.
https://en.wikipedia.org/wiki/List_of_countries_by_Internet_connection_speeds. There is insufficient data (number (5) of ASEAN countries) in Wikipedia
...
Based on measurements made to subscribers. Provides upload and download. We use the upload. The results are strange in that unline thatk all the other measurements, Singapore is ranked behind Thailand and Vietnam. Thus we not use this data in the comparisons.
NationMaster
Their most recent data is for 2005 for which PingER has data for only 4 ASEAN nations (Brunei, Indonesia, Malaysia and Singapore). Thus we do not use this data for comparisons.