Project Description
PingER SmokePing Integration aims at using Smokepings's rrd tool to visually display pingER's data in the form of graphs. The previous graphs that pingER are using are thee GNU graphs at Fermi lab (you can get to them by clicking on Remote host in pingtable.pl) . These graphs shows the RTTs (on the left hand scale) and Losses (on the right hand scale). These graphs does not show any indication of jitter. The current implementation using RRD tool is a standard and more flexible way of doing it. It shows the losses by color and jitter by smoke in addition to Round trip time.
Background
The pingER data files are located at /nfs/slac/g/net/pinger/pingerdata/hep/data/ Here is a format of a sample pingER file
| Code Block |
|---|
143.108.30.100 143.108.30.100 www.al.sp.gov.br 200.144.27.132 1000 10491552 10 10 10 32 32 33 0 1 2 3 4 5 6 7 8 9 33 33 32 32 32 32 32 32 33 33 143.108.30.100 143.108.30.100 www.al.sp.gov.br 200.144.27.132 1000 10491552 10 10 10 31 32 37 0 1 2 3 4 5 6 7 8 9 33 32 32 31 32 32 32 32 32 37 143.108.30.100 143.108.30.100 enterprise.uspnet.usp.br 143.107.151.2 1000 10491552 10 10 10 5 6 7 0 1 2 3 4 5 6 7 8 9 7 5 6 6 6 6 7 6 6 6 143.108.30.100 143.108.30.100 enterprise.uspnet.usp.br 143.107.151.2 1000 10491552 10 10 10 5 7 20 0 1 2 3 4 5 6 7 8 9 8 5 5 7 7 7 5 6 20 6 143.108.30.100 143.108.30.100 stromboli.incor.usp.br 200.9.95.6 1000 10491552 10 10 10 7 7 10 0 1 2 3 4 5 6 7 8 9 8 7 7 7 7 7 10 7 9 9 143.108.30.100 143.108.30.100 stromboli.incor.usp.br 200.9.95.6 1000 10491552 10 10 10 7 8 20 0 1 2 3 4 5 6 7 8 9 20 8 7 7 7 7 7 7 8 7 143.108.30.100 143.108.30.100 border2-e04-core.cas.ansp.br 143.106.99.74 1000 10491552 10 10 10 5 5 6 0 1 2 3 4 5 6 7 8 9 6 5 6 5 6 6 5 5 5 5 143.108.30.100 143.108.30.100 border2-e04-core.cas.ansp.br 143.106.99.74 1000 10491552 10 10 10 5 5 6 0 1 2 3 4 5 6 7 8 9 6 5 5 5 6 5 6 5 6 5 |
RRD Format
The RRD files can be found at /nfs/slac/g/net/pinger/pingerdata/hep/RRDCache
The three main functions used are:
Command line usage
| Code Block |
|---|
rrdtool create sss.rrd --start 1174347943 --step 1800 DS:uptime:GAUGE:3600:0:UDS:loss:GAUGE:3600:0:UDS:median:GAUGE:3600:0: UDS:ping1:GAUGE:3600:0:UDS:ping2:GAUGE:3600:0:UDS:ping3:GAUGE:3600:0:UDS:ping4:GAUGE:3600:0:UDS:ping5:GAUGE:3600:0:UDS:ping6 :GAUGE:3600:0:UDS:ping7:GAUGE:3600:0:UDS:ping8:GAUGE:3600:0:UDS:ping9:GAUGE:3600:0:UDS:ping10:GAUGE:3600:0:URRA:AVERAGE: 0.5:1:5760 |
| Code Block |
|---|
rrdtool update sss.rrd 1174477592 : NaN:0:0.0251:0.0248:0.0249:0.025:0.025:0.0251:0.0251:0.0251:0.0252:0.0254:0.026 |
Architecture
The scripts that produce the Pinger data files and the RRD files are placed at : /afs/slac.stanford.edu/package/pinger/smokeping (Added by AmberZeb 03/07/2012)
The scripts that produce the RRDs are located in /afs/slac/g/scs/net/netmon/pinger_smokeping/bin.
The CGI scripts are located in /afs/slac/g/www/cgi-wrap-bin/net/shahryar/smokeping.
| Note |
|---|
overview of the how the files interrelate; how the program scripts are run (detail of the cron jobs etc). |
Package Description
SelectSrcDest.pm
This is the Perl module that acts as a daemon process and runs as a cron every night, to call the main conversion module, which is the PingERtoSmokeping.pm. As it traverses the PingER data and converts it into SmokePing format .rrd files using the PingERtoSmokeping.pm, it also enters information into the srcdest.txt file of the data converted. This information includes the name of monitoring sites and under the name of each monitoring site is listed the identification keys corresponding each monitoring site. The identification key consists of the following information with an underscore between each piece of information:
- The monitoring site host name
- The remote site host name
- Number of bytes per ping
- Number of pings sent to remote host
An example of information contained in the srcdest.txt file is:
| Code Block |
|---|
monitor.niit.edu.pk monitor.niit.edu.pk_monalisa.niit.edu.pk_1000_10 monitor.niit.edu.pk_monalisa.niit.edu.pk_100_10 monitor.niit.edu.pk_www.niit.edu.pk_1000_10 **** |
The four stars separate the information of one monitoring site from the other. The benefit of this srcdest.txt file is that a list of keys against which the converted data is available, is formed so that when a user clicks on one item in the list the graph.cgi can plot the converted data against the key. Conversely if the file was not there, and the user entered his choice of monitoring site, remote site, ping packet site, number of ping packets hoping that the data for this combination is present, he might be wrong. It's easy for the user to select what exists, then to let him guess by allowing him to make the selection.
PingERtoSmokeping.pm
This is the main conversion code, which is called by the daemon process SrcDest.pm daily to convert the data for the last 120 days from that date. After an RRD file has been formed for a single source and destination pair (and number of bytes per ping and pings per remote site), then next day only one day's data will be appended at the end of the file and the data for the first day removed. In this way there will always be data in the file for the "last" 120 days. It is necessary to mention that PingER files within a particular folder consist of all the data for a source (one folder for each source is there).
CGI Modules
There are three CGI modules.
Form.cgi
Displays the data in srcdest.txt file to the user, so that the user can make his selection
graph.cgi
Generates graphs using the rrd graph method.
saveimage.cgi
It is called from graph.cgi and displays the contents of the image to the user.
Modules | Function |
|---|---|
SelectConvSrcDest1.pm | This program is to be setup as a cron job to run every 24 hours (after installing on a server with a PingER data source) |
PingERtoSmokeping.pm | PingERtoSmokeping.pm is a tool to convert PingER data files into Smokeping data files. |
Configuration files | Function |
srcdest.txt | The file that stores unique SourceSite_DestinationSite_PacketsSize_NumberOfPings(maximum) combinations found in PingER data. |
CGIs | Function |
form.cgi | Displays the SourceSite_DestinationSite_PacketsSize_NumberOfPings(maximum) RRDs(data) available for the monitoring site or node slected from pingtable.pl by user. |
graph.cgi | Generates graphs from the rrd files on the fly and display them to the user and then deletes the graph from cache |
saveimage.cgi | Displays the contents of the image to the user |
Detailed description can be found at MAGGIE - SEECS - Smokeping.
Performance Analysis
In order to get list of unique Source Destination pairs (links) SelectSrcDest1.pm used to traverses through all the raw pinger files for the last 120 days and generated the list. This was extremely expensive in terms of time consumed so we needed to reduce this. This was reduced to one day which made the code 120 times more faster.
I used the Benchmark library and applied it on create_File function. Here is the result of creating 10 RRDs on nfs space
| Code Block |
|---|
CreateRRD took:38 wallclock secs (19.76 usr 3.99 sys \+ 2.57 cusr 0.82 csys = 27.14 CPU) CreateRRD took:38 wallclock secs (20.06 usr 3.39 sys \+ 2.46 cusr 0.84 csys = 26.75 CPU) CreateRRD took:67 wallclock secs (21.25 usr 9.75 sys \+ 2.49 cusr 1.03 csys = 34.52 CPU) CreateRRD took:66 wallclock secs (21.19 usr 9.06 sys \+ 2.73 cusr 0.90 csys = 33.88 CPU) CreateRRD took:68 wallclock secs (20.97 usr 9.47 sys \+ 2.78 cusr 0.74 csys = 33.96 CPU) CreateRRD took:68 wallclock secs (20.80 usr 9.40 sys \+ 2.44 cusr 0.96 csys = 33.60 CPU) CreateRRD took:23 wallclock secs (19.19 usr 0.86 sys \+ 2.27 cusr 0.91 csys = 23.23 CPU) CreateRRD took:23 wallclock secs (19.09 usr 1.13 sys \+ 2.55 cusr 0.92 csys = 23.69 CPU) CreateRRD took:66 wallclock secs (21.13 usr 8.45 sys \+ 2.53 cusr 0.93 csys = 33.04 CPU) CreateRRD took:67 wallclock secs (21.24 usr 9.61 sys \+ 2.23 cusr 0.91 csys = 33.99 CPU) |
I created the same 10 RRD files on local disk, clearly its less expensive to write to local disk.
| Code Block |
|---|
CreateRRD took:22 wallclock secs (19.75 usr 0.79 sys \+ 2.60 cusr 0.75 csys = 23.89 CPU) CreateRRD took:21 wallclock secs (19.66 usr 0.85 sys \+ 2.70 cusr 0.76 csys = 23.97 CPU) CreateRRD took:24 wallclock secs (20.49 usr 1.44 sys \+ 2.49 cusr 0.83 csys = 25.25 CPU) CreateRRD took:23 wallclock secs (20.77 usr 1.11 sys \+ 2.53 cusr 0.88 csys = 25.29 CPU) CreateRRD took:23 wallclock secs (20.88 usr 1.26 sys \+ 2.40 cusr 0.90 csys = 25.44 CPU) CreateRRD took:24 wallclock secs (20.91 usr 1.06 sys \+ 2.39 cusr 0.96 csys = 25.32 CPU) CreateRRD took:21 wallclock secs (19.11 usr 0.50 sys \+ 2.42 cusr 0.97 csys = 23.00 CPU) CreateRRD took:21 wallclock secs (19.13 usr 0.62 sys \+ 2.58 cusr 1.02 csys = 23.35 CPU) CreateRRD took:23 wallclock secs (20.77 usr 1.12 sys \+ 2.56 cusr 0.82 csys = 25.27 CPU) CreateRRD took:23 wallclock secs (20.79 usr 1.12 sys \+ 2.36 cusr 0.87 csys = 25.14 CPU) |
The update function takes very little time as compared to create function. Here is the data for the update function for the same three RRDs
| Code Block |
|---|
CreateRRD took: 4 wallclock secs ( 3.56 usr 0.05 sys \+ 0.43 cusr 0.05 csys = 4.09 CPU) CreateRRD took: 3 wallclock secs ( 3.55 usr 0.04 sys \+ 0.44 cusr 0.01 csys = 4.04 CPU) CreateRRD took: 4 wallclock secs ( 3.57 usr 0.07 sys \+ 0.54 cusr 0.09 csys = 4.27 CPU) |
The code created new RRD files based on unique source, destination and number of packets sent. Since the number of packets sent is variable for each day, it created a new RRD file each day which is very expensive. An average of 100 additional RRDs were created every day which costs 10 hours time to run. I have set the value of the number of packets sent to 10, so now only the previous RRDs will be updated and no new RRD will be created. So this will cause the script to run much faster( will takes on average 10 hours less to run daily).
On a pinger machine with 2 X 2.00 GHZ processors it takes 95 secs to create a new rrd file and few seconds to update. Total files to be created/updated are 630. So, for the first time a rough estimate is 16.25 hrs to complete the job
Cron Jobs
I have run SelectSrcDest1.pm as a cron job which is supposed to run every 24 hours to generate the rrd files for unique source destination pairs. The cron job is set as a TrsCron tab and is supposed to run at 12:00 am midnight on tersk08 machine.
Example
Here is an example of a congested link in China (www.hz.zj.cn). You can clearly see the day night effect here and huge losses. In first graph shows the data for the last two days in this case. (By default it shows the last 120 days and can be changed by selecting the date). The second one shows the data for the last 10 days and the third one shows the data for the last 30 days. 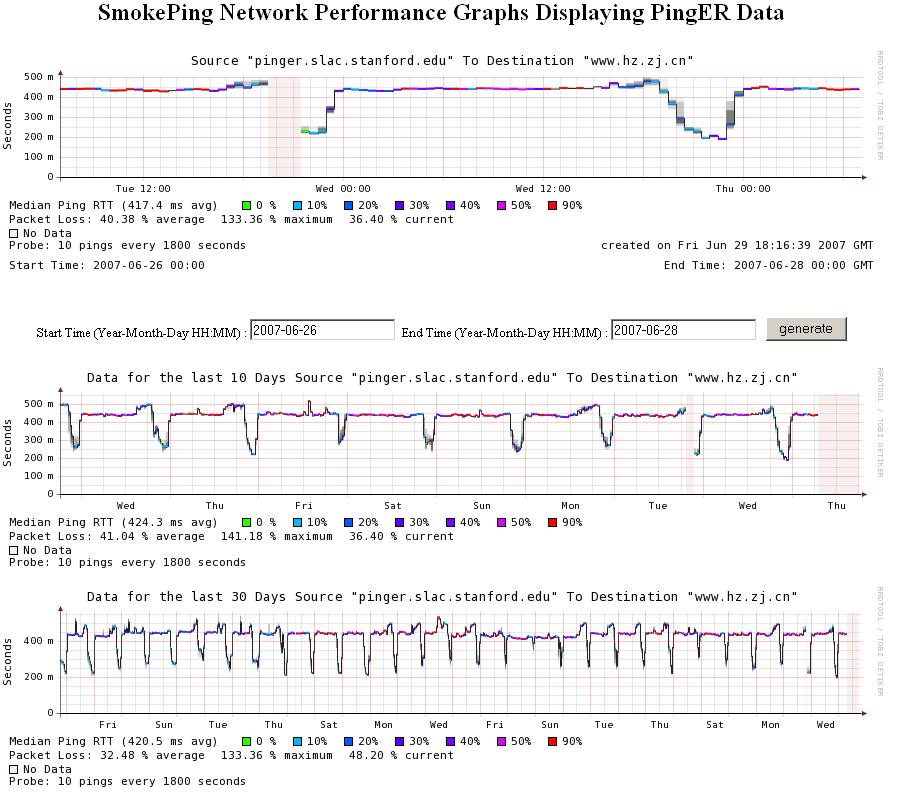
Interpreting the Graph
Smoke colors
| Include Page | ||||
|---|---|---|---|---|
|