...
Given that we have measurements from SLAC to most countries in the world, we can translate them to indicate what connectivity is likely to most countries in the world for various types of applications such as email, web, VoIP, holding Skype meetings, data transfer rates, and real-time interactivity such as haptic surgery or gaming etc. This is very valuable for:
...
- travellers to meetings
- longer term visitors etc
- collaborators
- As SLAC has diversified from an HEP site there are is an increased number of scientists interested in collaborating with SLAC. This is particularly so for developing regions such as Africa, South Asia, the Middle East, Latin America etc. PingER with its emphasis on the Digital Divide is well positioned to provide relevant performance information
- In addition, there are scientific centers of interest to SLAC in developing regions. These include telescopes in Chile, the SESAME synchrotron Lab in Jordan and in particular from Africa
- There is the Square Kilometer Array[1] with cores in Sub-Saharan Africa and Australia costing €1.5 billion, with construction starting 2016, and initial observations 2019. The network traffic requirements are equivalent to ten times the Internet traffic today.
- Aug 30, 2012: CERN donated 220 computer servers from CERN to the Kwame Nkrumah University of Science and Technology in Ghana[2].
- Strategic plan for a synchrotron light source in southern Africa[3] championed by SLAC’s own Herman Winick
- Drugs from rain-forest, environment studies, geo-physics
- Six HEP International Conferences in Madagascar[4]
- Bear in mind
More funding and better Internet connectivity access are helping [Africa]. The number of scientific papers produced by Africans has tripled in the past decade, to over 55,400 in 2013 according to Reed Elsevier. That still only accounts for 2.4% of the world’s total but is quite a jump. The quality is rising too. From Economist August 9th, 2014.
- collaboration examples
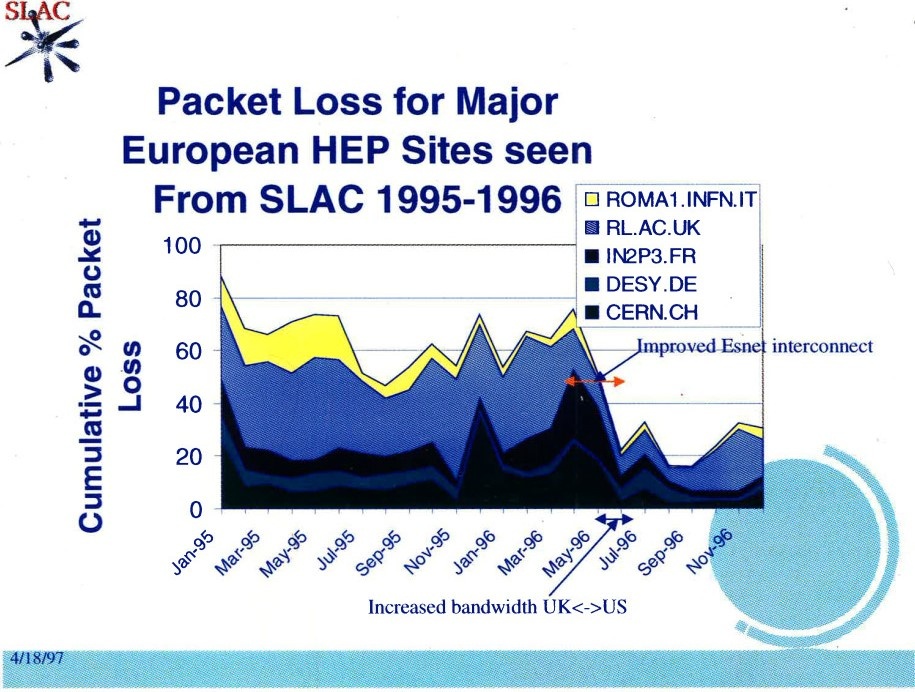
- Several High Energy Physics (HEP) experiments have introduced the concept of regional computer centers. Typically there a few of these (e.g. BaBar regional computer centers in France, Italy, and the U.K. as well as the main center at SLAC). These centers are expected to perform much of the computing required by the collaboration and so need good connectivity to the experiment in order to get a copy of the data and to be able to share the results. By using PingER to measure the loss and RTT, we are able to provide expectations for the performance for bulk data transfer and other applications.
- When putting together the Particle Physic Data Grid (PPDG) proposal (a collaboration of 3 universities and 6 Labs), it was very valuable to be able to look at the PingER data and evaluate what the performance between the sites would be like with the existing production links. As a result of this, we put together a web site website for the PPDG collaboration focussed on the PingER results for the collaborators.
...
Choosing an ISP for home connectivity, e.g. for telecommuniting telecommuting etc.:
In 1996, SLAC wanted to recommend a an ISDN Internet Service provider (ISP) for people wishing to connect to SLAC from their homes in the San Francisco Bay Area. To evaluate the connectivity that the various ISPs could provide we decided to use PingER to monitor the ISP gateways in areas where we had several potential SLAC users. The results enabled us to select an ISP who had low loss and good RTT. We continued the monitring monitoring after selecting the ISP and used it to request improvements to and identify problems with the ISP. We also used the information to recommend a second ISP and remove our recommendation on the first ISP. Finally, due to inconsistent performance, we removed all recommendations for ISPs and provided our own ISDN service.
In 1999, SLAC wanted to recommend a DSL ISP for people wishing to connect to SLAC from their home. There were 2 major contenders, one of which was about twice the price of the other. We needed to compare the performances of the 2 ISPs, so we set PingER to monitor nodes on both networks from SLAC. We discovered that the TCP thruput of the more expensive ISP was an order of magnitude better. This was very valuable information that we were able to provide to prospective users to help in making a decision.
...
From the PingER reports, we identified that some U.S. universities had poor to bad connectivity to ESnet sites. This was impeding some collaborations. In 1997, a working group was formed by the ESnet Steering Committee (ESSC) to review the situation and provide recommendations. We selected the top 20 universities (ranked by DoE funding) which did not have direct ESnet connections and made sure they were all monitored by PingER. After reviewing the results, we identified those (there were 4) with very poor (> 5% packet loss) and poor (> 2.5% loss) connectivity (there were 8) over a period of 4 months. This list was then reviewed to look at the existing plans for improved connectivity (in particular several of the universities were about to join the vBNS). The information was then provided to the ESnet management to evaluate the cost of prviding providing direct ESnet connections for each of the universities. This exercise was repeated a year later, except the threshold was reduced to 1%. This time there were 2 with poor packet loss (> 2.5%) and 8 with acceptable packet loss (>1%).
...
From a detailed Case Study on NIIT Pakistan, we were able to identify that the problem with connectivity to universities in Pakistan was not due to the performance of the Pakistani National Research and Education Network (NREN) supplied by PERN but rather due to the poor last mile connections to the university sites. These were dramatically congested. This was reported to the head of the Higher Education Commission (HEC) Atta ur Rahman and led to the upgrading of the links to universities.
...
In one example of this we compared the performance between SLAC/ESnet or Stanford and Colorado State (see Routing via Campus), discovered it was much better (factor of 2 less RTT) via Stanford, and then worked with the ESnet NOC to change ESnet's routing to Colorado State to make a big improvement.
In another case, we compared the performance between SLAC/ESnet or Stanford and PacBell's Internet. In the former case, the traffic went via the STARTAP in Chicago and sustained RTT's of around 130 msec. In the latter case, it went via Palo Alto and sustained an RTT of about 30 msec.
...
The earthquake and tsunamis in Japan caused cable cuts (see Japanese Earthquake March 11th, 2011) which resulted in interruptions in connectivity and increased round-trip times caused by re-routing of traffic to avoid fibre optica optic cables severed off the West costs of Japan
...
For example for the Arab Spring (see The Arab Spring 2011 and Internet Instability seen by PingER, Egypt shuts down their Internet) the main impact was the loss of connectivity die due to government shut-downs of Internet access.
Network upgrades
Quantifying the Impact of Changes
...
- Bridging the Digital Divide South Africa needs cheap, fast, and reliable bandwidth to fulfil fulfill its aspirations . not just in big science, but to reach its development goals as well. Phil Charles demonstrates the relationship between astronomy and the Internet and argues that the time has come for bold action.
- Internety Cimmunications Internet Communications Using SIP, Delievering Delivering VoIP and Multimedia Services with Session Initiation Protocol, by Henry Sinnreich ansd and Alan B. Johnson, Published by Wiley Publishing, Fig 18.3 2nd Edition.
- Email from Mike Jensen, 12/17/2011 2011, I'm writing a chapter for a book commissioned by the w3 foundation on internet access and i I wanted to use one of your pinger project graphics
- Symmetrry Magazine, Violume Volume 5, Issue 4, September 2008.
- Email from Yohei Kuga at KEIO University, 5/14/2011 I'm Yohei Kuga at KEIO University from Japan. Now I'm writing a book that topic is Internet architecture and current status written in Japanese. And in this book, I hope to introduce PingER activities with 'PingER metrics intensity map'. Could I use PingER metrics intensity map image in the book? (image URL: http://www-iepm.slac.stanford.edu/pinger/intensity-maps/pinger-metrics -intensity-map.html) We think Image size is one-half page (about size is 10cm x 8cm) with image source and references.
- Email from Katherine Blundell, oct Oct 15, 2009, I have come across an interesting plot attributed to you on page 1 of the attached article, showing growth in bandwidth to various countries, particularly developing ones. Is there an updated version of this plot you might be willing to let me have? This is partly for my own interest, and partly because I will be speaking tomorrow at the annual Microsoft Research e-Science workshop on a project of mine (www.GlobalJetWatch.net) involving deploying telescopes various countries separated in longitude. While the project is research-driven, there is an important educational/outreach component with a web-learning site to help encourage children in developing countries to learn - and love - science, but could potentially be hindered by lack of bandwidth to these countries. I was tentatively wondering about very briefly making this point at this particular workshop, but obviously, I would only do this if you were happy for me to, and I would of course fully attribute the plot to you.
- Email from Katie Yurkewicz I am currently creating a Web site companion for Science Grid This Week, and I would like your permission to include the PingER plot I used in Science Grid This Week in the new site's image bank. The site will be called the Science Grid Network, and will host Science Grid This Week and include science grid-related images, links, and presentations. The image bank will be part of the existing interactions.org image bank (http://www.interactions.org/imagebank/) and subject to that bank's permission policy. I will include your name and email address as a contact for the image unless you request otherwise. The image I intend to archive is shown here: http://www.interactions.org/sgtw/2005/0622/pinger_more.html Please let me know if I have permission to archive the image. If you have another PingER image that you'd rather I use, or any other images, links or introductory grid-related presentations that you would like to include on the site, please send them along!
- Email from robert_mitchell@computerworld.com 12/21/2005 Computerworld would like to publish the pie charts on page 7 of your January 2005 IDFA SCIC Network Monitoring Report and source them to the ICFA at Stanford. This would be for an infographic concerning Internet reliability and would be part of a larger feature I am writing on the Internet and telecommunications services. Can you let me know before the holidays if you have any objections or if there are issues you would like to discuss, such as proper sourcing?