...
PingER's main metric for measuring jitter is the IPDV. A typical IPD distribution from which the IPD is derived is shown below.
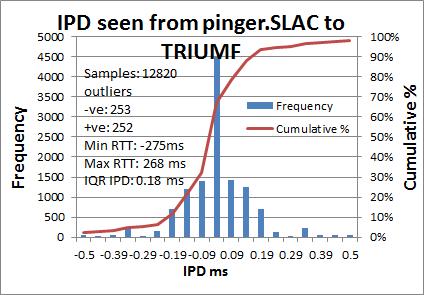
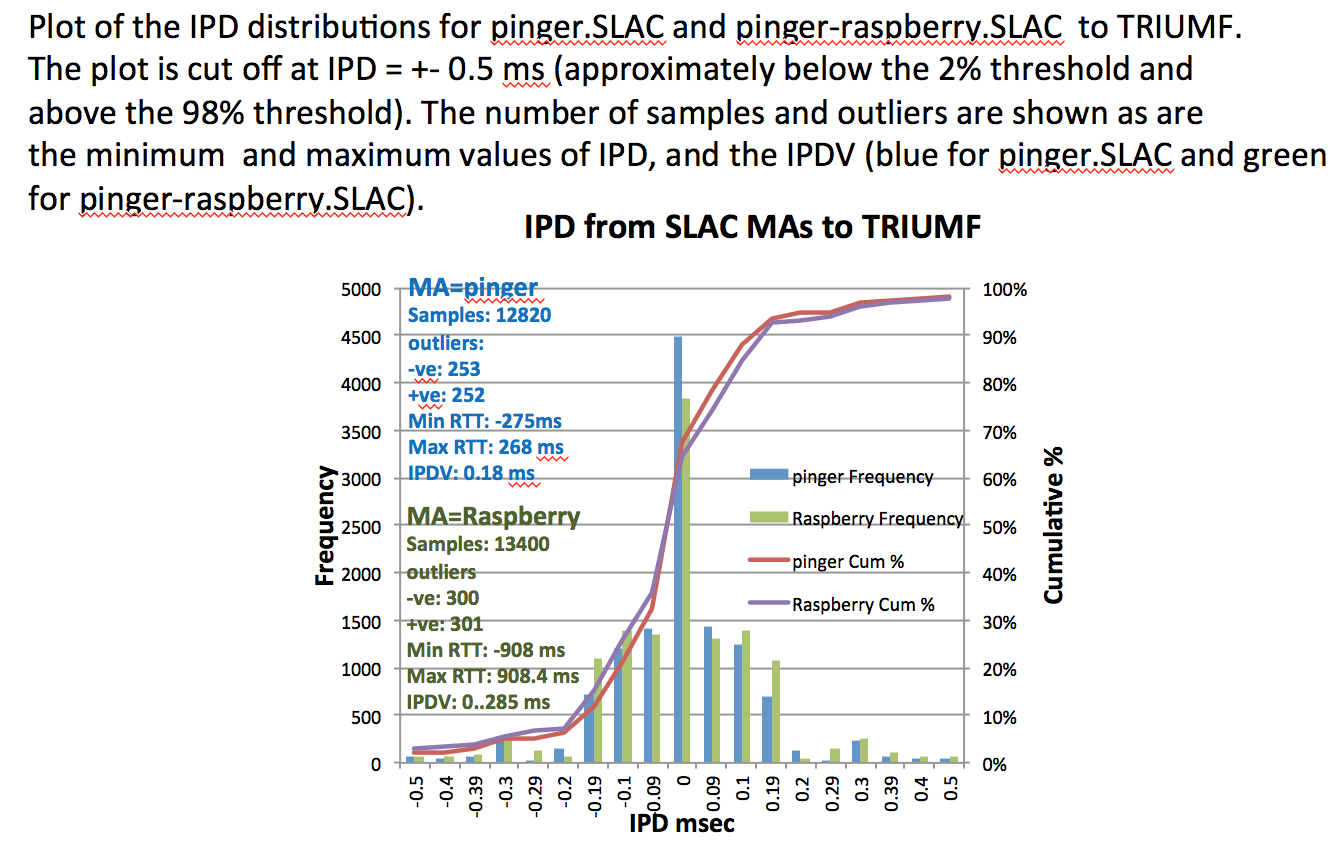
IPD distributions are centered on 0ms and have very wide tails. The one in the figure is cut off below the 2 percentile and above the 98% percentile. The number of outliers not shown is given in the figure, as are the maximum and minimum values of IPD. The distribution is thus seen to have very positive and negative tails. Also as illustrated in the figure a typical IPD distribution has a very sharp peak. To derive the IPDV we take the IQR of the IPD dsitribution. The values for the IPDV for the various measurements are shown in the followjng table; The errors(S) in the IPD are taken from the IQR for the hourly PingER IPDVs observed for the same period. It is seen that the Z-Test in this indicates a value of < 2.0. Assuming the Z-Test is relevant for the non-normal IPD distributions if one uses the IQRs instead of the standard deviation, a value of < 2 for the Z-test statistics indicates the two samples are the same (see http://homework.uoregon.edu/pub/class/es202/ztest.html.
Powerpoint of figures.
Kolmogorov-Smirnov Test
...