...
- The Min RTT error is the IQR of the minimum RTTs from each set of pings for the time period.
- The Avg RTT error is the standard deviation of all the average RTTs from each set of pings for the time period
- The Median RTT error is the IQR of all the individual RTTs from all sets of measurements for the time period
- The IQR IPD IPDV error is the IQR of the hourly IQRs for the time period (see Spreadsheet)
...
We used the Z Tests to compare two samples, see for example “Comparing distributions: Z test” available at http://homework.uoregon.edu/pub/class/es202/ztest.html
Spreadsheet of min (ipdv-errors) has min/avg/max, % and loss between and from pinger & pi to & from sitka, and to cern, plus histograms probabilities, IPDV errors.
Spreadsheet of probabilities and (prob) (Probability table as submitted, IPDV from SLAC to TRIUMF. Also images of IPD graphs from frequency.pl. The IPD distribution from pinger to SLAC has the figure below.
However the ping distributions are decidedly non-normal (see for example the figure below) have wide outliers, and are heavy tailed on the upper side (see https://www.slac.stanford.edu/comp/net/wan-mon/ping-hi-stat.html). This leads to large standard deviations (one to two order of magnitude greater than the IQR) in the RTT values. As can be seen from the table this results in low values of the Z-test and a false probability of no significant statistical difference. Using the IQRs of the frequency distributions instead generally leads to much higher values of the Z-test and hence a higher probability that the distributions of RTTs between two pairs of hosts are significantly different. Comparing the frequency distributions it is seen that there is indeed a marked offset in the RTT values of the peak frequencies and a resultant difference in the cumulative RTT distributions, Using the non-parametric Kolomogorov Smirnoff test (KS test) also indicated significant differences in the distributions.
Average RTTs from pinger.SLAC and pinger-raspberry.slac to TRIUMF (Figure can be found in https://confluence.slac.stanford.edu/download/attachments/192190786/ipdv-errors.xls) The plot cuts off at about the cumulative 98%. The number of overflows not plotted are indicated. |
|---|
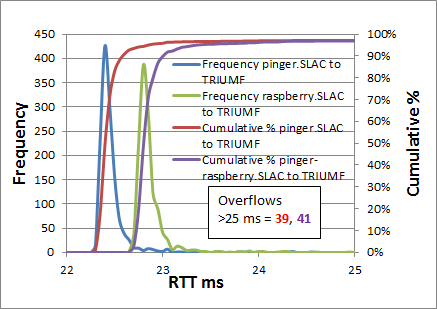 |
The RTT measurements made from pinger.SLAC and pinger-raspberry.SLAC to TRIUMF and CERN average around 23ms and 151ms respectively. Despite this large difference in average RTTs', comparing the average RTTs from pinger.SLAC with those from pinger-raspberry.SLAC yields a difference of only ~0.35ms for both TRIUMF and CERN.
...