...
| Table of Contents |
|---|
Introduction
This document is the basis of a paper comparing PingER performance on a 1 U bare metal host to that on a Raspberry Pi.
This is a project suggested by Bebo White to build and validate a PingER Measurement Agent (MA) based on an inexpensive piece of hardware called a Raspberry Pi (see more about Raspberry Pi) using a linux distribution as the Operating System (see more about Raspbian). If successful one could consider using these in production: reducing the costs, power drain (they draw about 2W of 5V DC power compared to typically over 100W for a deskside computer or 20W for a laptop) and space (credit card size). This is the same type of power required for a smartphone so appropriate off the shelf products including a battery and solar cells are becoming readily available. Thus the Raspberry could be very valuable for sites in developing countries where cost, power utilization and to a lesser extent space may be crucial.
...
Obs: Make sure to change the default password for Raspbian.
...
Requirements
Two major points need to be addressed before we can comfortably deploy Raspberry PI MAs.
- The Raspberry Pi PingER MA must be robust and reliable. It needs to run for months to years with no need for intervention. This still needs to be verified, so far the Raspberry Pi has successfully run without intervention for over a month. This has included automatic recovery after two test power outages.
- The important metrics derived from the measurements made by the Raspberry Pi should not be significantly different from those made by a bare metal PingER MA, or if they are then this needs to be understood.different from those made by a bare metal PingER MA, or if they are then this needs to be understood.
- The Raspberry Pi needs to be able to run 24 hours a day with only solar derived power. Let's say the power required is 3W at 5V or (3/5)A=0.6A. If we have a 10,000 mAh battery, then at 0.6A it should have power for 10Ah/0.6A ~ 16.6 hours. Then we need a solar cell to be able to refill the battery in a few hours of sunlight. Let's take a 20W 5 V solar panel (see http://www.amazon.com/SUNKINGDOM-trade-Foldable-Charger-Compatible/dp/B00MTEDTWG) = 20/5= 4 A solar panel. So initial guess is 10A-h/4A = 2.5hours. But inefficiences (see http://www.voltaicsystems.com/blog/estimating-battery-charge-time-from-solar/) of say 2.5 extends this to 6.25 hours.
We define the important metrics measured by PingER as being the minimum, average, median and jitter of the RTTs, the packet loss, together with the reachability (i.e. a target host is unreachable when no ping requests are responded by the target host). These are the main metrics that impact applications such as throughput, voice over IP, streaming video, haptics, and estimating the geolocation of a host by pinging it from well know landmarks. Such differences might result in significant discontinuities in the metric measurements if we were to change the monitoring host from a bare metal server to a Raspberry Pi.
...
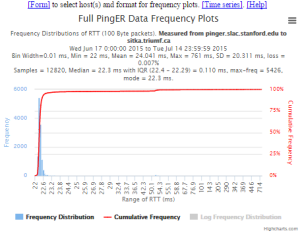
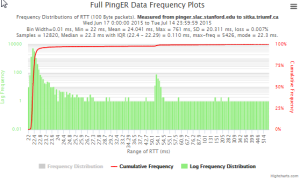
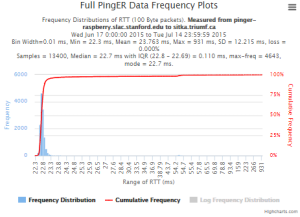
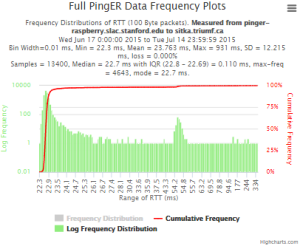
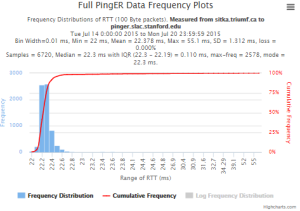
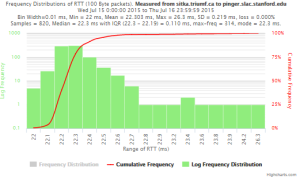
| pinger.slac.stanford.edu to sitka.triumf.ca | pinger-raspberry.slac.stanford.edu to sitka.triumf.ca | ||
|---|---|---|---|
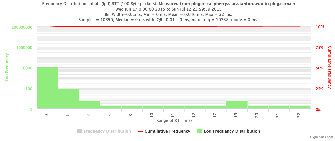
| Time Series | 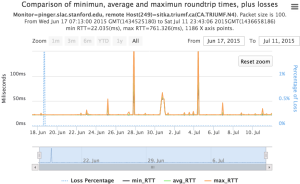 | 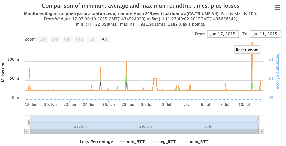 | |
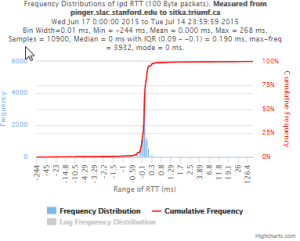
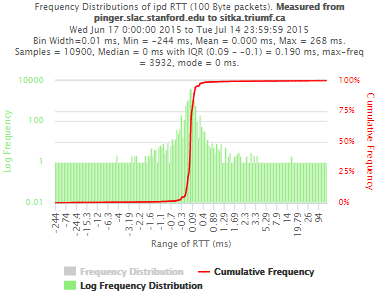
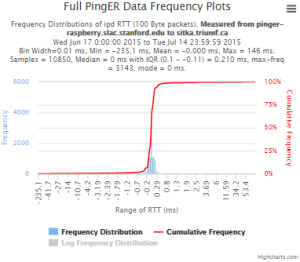
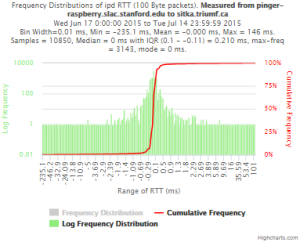
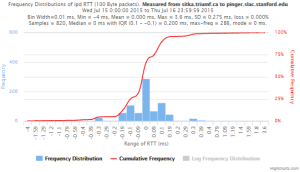
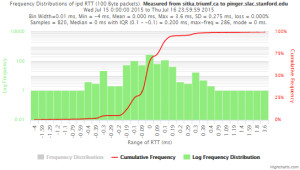
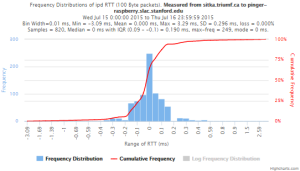
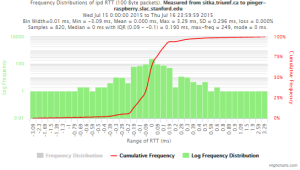
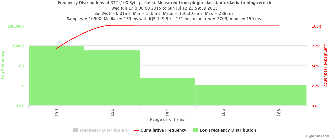
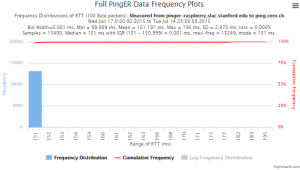
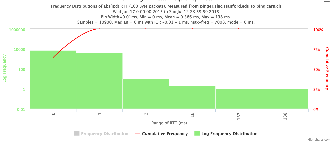
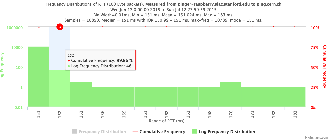
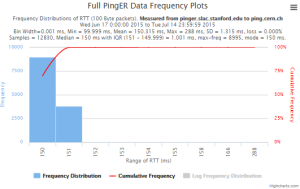
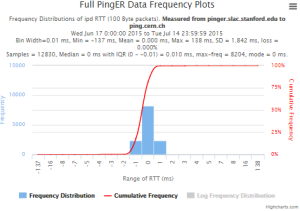
| Frequency distribution RTT |  |
|
 |
| Frequency distribution Abs(IPD) | 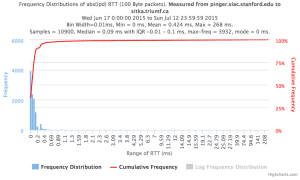 | 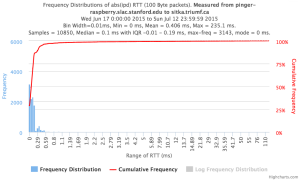 | |
| Frequency distribution IPD |
|
|
...
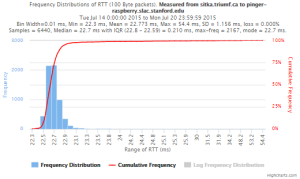
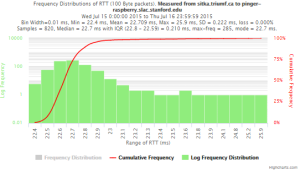
| sitka.triumf.ca to pinger.slac.stanford.edu | sitka.triumf.ca to pinger-raspberry.slac.stanford.edu | ||
|---|---|---|---|
| Time series | 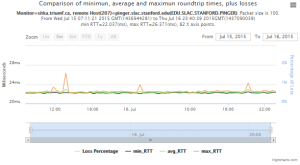 | 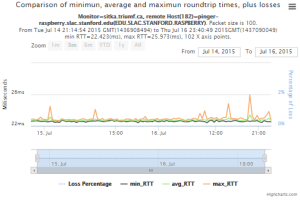 | |
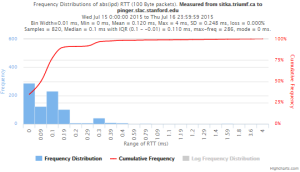
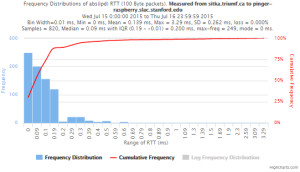
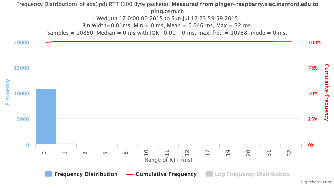
| Frequency Distribution of RTT |
|
| |
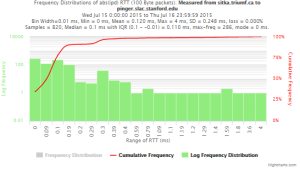
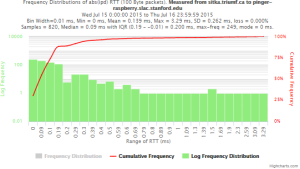
| Frequency distribution of Abs(IPD) |
|
| |
| Frequency distribution of IPD |
|   |
|


To
...
ping.
...
cern.
...
ch from SLAC
| To ping.cern.ch from pinger | To ping.cern.ch from pinger-raspberry | |
|---|---|---|
| Time series | 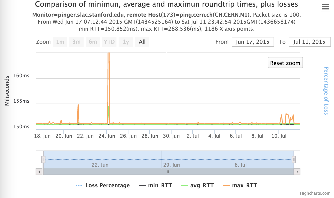 | 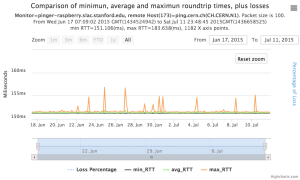 |
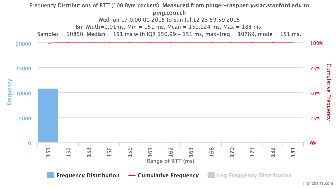
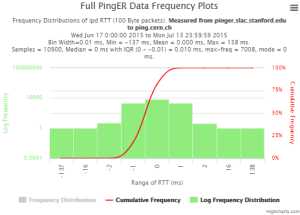
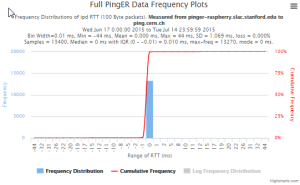
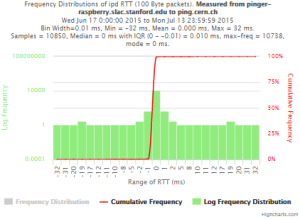
| Frequency Distribution RTT |
|    |
Frequency Distribution Abs(IPD) |
 |
 |
| Frequency Distribution IPD |
|
|


Results
The table below shows the various aggregate metrics measured from MA to target comparing pinger.slac.stanford with pinger-raspberry.slac.stanford.edu. The columns are arranged in pairs. The first of each pair is for pingerr.slac.stanford.edu, the second for pinger-raspberry.slac.stanford.edu. Each pair is measured over the same time period. Different pairs are measured over different time periods.
...