...
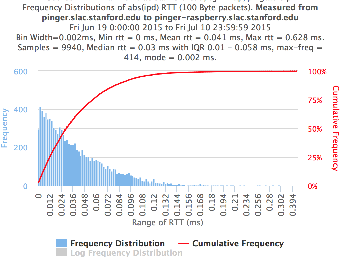
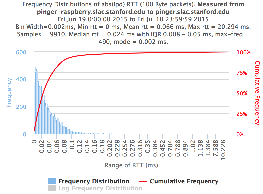
The magnitude of the RTT is very dependent on the distance of the path between the source and destination. Many applications such as voice over IP, video streaming, or haptics are very dependent on the variability or jitter of the RTT. The jitter is often more dependent on the network edges. There are many ways to calculate the jitter (see for example http://www.slac.stanford.edu/comp/net/wan-mon/tutorial.html#variable). We calculate the absolute inter packet delay and display its frequency distribution.
 |  |
| Metric | pinger to pinger-raspberry | pinger-raspberry to pinger |
|---|---|---|
Min RTT | 0.43 ms | 0.41 ms |
| Avg RTT | 0.542 ms | 0.529 ms |
Max RTT | 1.15 ms | 20.8 ms |
| Median RTT | 0.542 ms | 0.51 ms |
| 25% | 0.514 ms | 0.48 ms |
| 75% | 0.564 ms | 0.532 ms |
| IQR | 0.05 ms | 0.052 ms |
| Min(abs(IPD)) | 0 ms | 0 ms |
| Avg(abs(IPD)) | 0.041 ms | 0.066 ms |
| Max(abs(IPD)) | 0.0628ms | 20.294 ms |
| Median(abs(IPD)) | 0.03ms | 0.024 ms |
| 25%(abs(IPD)) | 0.01ms | 0.008 ms |
| 75%(abs(IPD)) | 0.058 ms | 0.05 ms |
| IQR(abs(IPD) | 0.048 ms | 0.042 ms |
Kolmogorov-Smirnov Test
The Kolmogorov-Smirnov test (KS-test) tries to determine if two datasets differ significantly. The KS-test has the advantage of making no assumption about the distribution of data. In other words it is non-parametric and distribution free. The method is explained here and makes use of an Excel tool called "Real Statiscs". The tests were made using the raw data and distributions, both methods had similar results except for the 100Bytes Packet that had a great difference in the results. The results using raw data says both samples does not come from the same distribution with a significant difference, however if we use distributions the result says that only the 1000Bytes packet does not come from the same distribution. Bellow you will find the graphs for the distributions that were created and the cumulative frequency in both cases plotted one above other (in order to see the difference between the distributions).
...