...
| pinger to Pinger-raspberry | pinger-raspberry to pinger |
|---|---|
 |  |
Using full set of pings
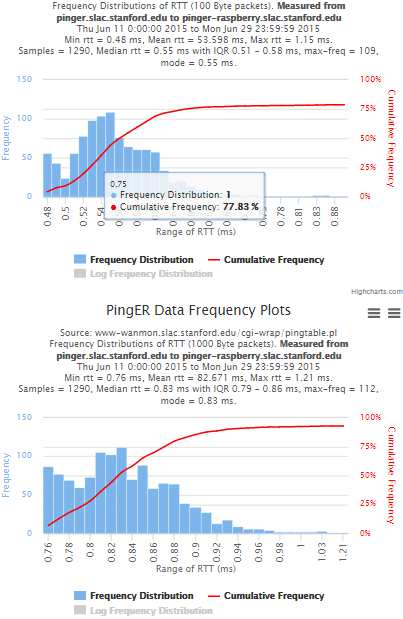
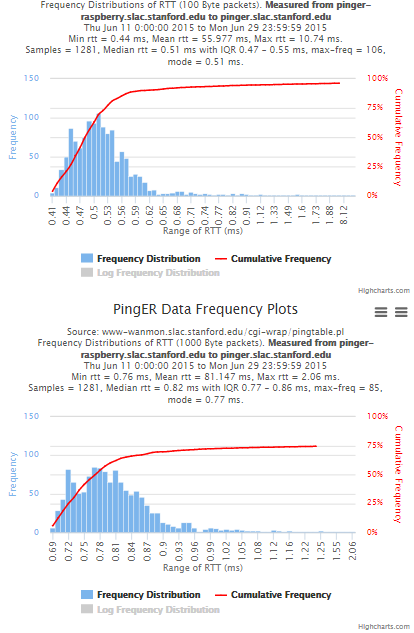
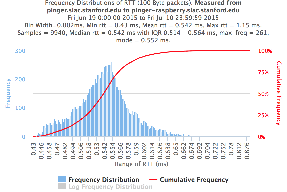
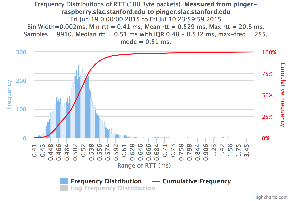
The frequency plots above are for the frequencies of the minimum, average and maximum RTTs. Below we show the frequencies when we take the individual pings (usually 10 assuming little loss) for all the ping RTTs in each measurement set.
| pinger to pinger-raspberry | pingr-raspberry to pinger |
|---|---|
 |  |
Kolmogorov-Smirnov Test
The Kolmogorov-Smirnov test (KS-test) tries to determine if two datasets differ significantly. The KS-test has the advantage of making no assumption about the distribution of data. In other words it is non-parametric and distribution free. The method is explained here and makes use of an Excel tool called "Real Statiscs". The tests were made using the raw data and distributions, both methods had similar results except for the 100Bytes Packet that had a great difference in the results. The results using raw data says both samples does not come from the same distribution with a significant difference, however if we use distributions the result says that only the 1000Bytes packet does not come from the same distribution. Bellow you will find the graphs for the distributions that were created and the cumulative frequency in both cases plotted one above other (in order to see the difference between the distributions).
...