...
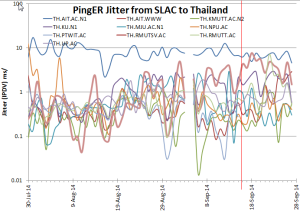
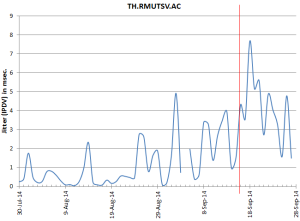
Looking at the jitter (measured as the Inter Packet Delay Variability (IPDV) for the Thailand hosts seen from SLAC we get the graph below (rmutsv is identified as the thicker line. We use a log scale to enable visibility of a wider range of values. The graph to the right just show rmutsv but this time on a linear y axis.
Traceroutes for rmutsv
These are shown below for Septmber 7 and 14, 2014 (before the cut) for September 16 (after the cut). It is seen that the first two are the same but the second after the cut is different.
...