An important part of calorimetry will be finding electron and photon showers. These showers are very similar, depositing most of their energy in the EM calorimeter, but electron showers have tracks leading to them. The first step is to find clusters that lie mainly in the EM calorimeter and use information about these clusters to train an HMatrix which can be used to categorize them. I will be using the electron and pion datasets to find appropriate measurements to distinguish the two and then test this heuristic with rho -> gamma + gamma and rho+ -> pi+ + gamma events.
Clustering
The first step is to create clusters. Since we are looking for small clusters in the EM cal, we can hope they will be contiguous. Thus we use a Nearest Neighbor clusterer which only adds cells to the cluster which are directly adjacent to those within it:
| No Format |
|---|
nnClusterer = new NearestNeighborClusterer(1,1,1,0,0.0); |
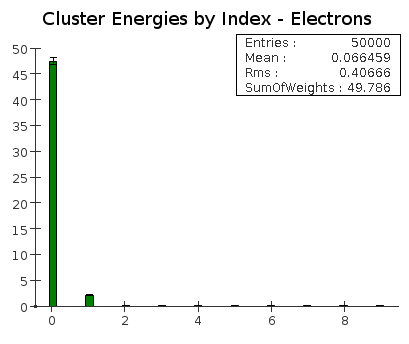
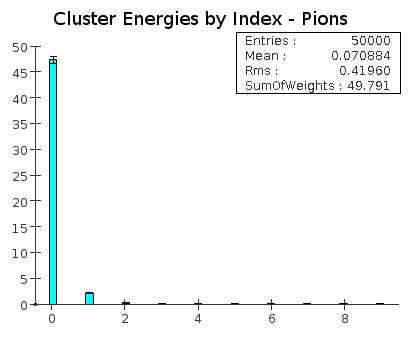
If a significant amount of energy is in multiple, non-contiguous clusters then we will have to find a way to stitch them together. Fortunately this is not the case with electrons or pions when we make no cuts on time or energy.
| Panel |
|---|
For both electrons and pions, an average of about 95% of the energy is contained in the highest energy cluster. |
Shower Shape and Profile
Now that we have our clusters, we can analyze them. Cluster objects in org.lcsim have a number of methods for obtaining information about a cluster. One is the getShape() method, which returns an array of six doubles. As of this writing, the last three values are not implemented and always return zero. The first value appears to be a measurement of the shower's energy profile by depth in millimeters. The second two appear to give orthogonal measurements of the shower width. The algorithm uses an inertial tensor to generate these values (see org.lcsim.recon.cluster.util.TensorPropertyClusterCalculator for the nitty gritty details; I don't quite understand it myself). See simplePlotter.java for the code used to make these plots.
| Panel |
|---|
The first three values of the getShape() parameter for electrons and pions using only the highest energy cluster with no timing or energy cuts. |

Creating and Testing an HMatrix
With these simple measurements of the clusters we can classify clusters from different particles using a hat matrix. org.lcsim has a convenient hat matrix class.
| No Format |
|---|
import org.lcsim.recon.emid.hmatrix.HMatrix; import org.lcsim.recon.emid.hmatrix.HMatrixBuilder; |
The basic principle of a hat matrix is comparing individual measurement vectors against a table of averages and covariances that is trained with relevant data. This comparison results in a chi^2 value, which is simply a measure of how similar the vector is to the data it was trained on, with 1 being the most similar. Thus, if we train a hat matrix with measurements of electron showers, we should be able to look at other showers and decide if it is an electron or not. Click here or here for more on hat matrices.
As a simple first test, I trained an HMatrix using the first three values of the shape vector on electron clusters and calculated chi^2 values using the same electron data and pion data (see attached files SimpleHMatrixBuilder.java and SimpleHMatrixTester.java). The histograms of these chi^2 values are below.
| Panel |
|---|
|
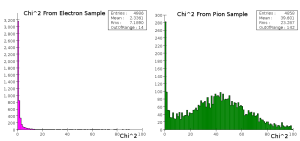
The electrons exhibit a very tightly constrained response, whereas the majority of the pions have a very high chi^2 value. There is a peak at 1 in the pion data, but it is one tenth the height of the electron peak. This is expected; the shape data for the pions showed small peaks at values near the electron peaks in all of the measurements. This implies that other categorizations must be used.