...
Eric suggested that looking at the POCA distance (in sigma) from ACD tiles should give different distributions for tiles that are hit than for those that have no hit. Basically, this is saying that you expect tiles without hits to have track POCA that are more than 1 sigma from the tile active boundary. On the other hand hit tiles are expected to have POCA with negative sigma (distances inside the active tile). The cross-over from dominantly positive sigma POCAe to negative sigma should be a sharp feature which is present in the data and MC.
Monte Carlo
Generate 10^5 CrProtonFor a set of CrProtons generated from a modified HEAD1.1365 of GR, I grab the projected and propagated track covariance projected onto the POCA planecovariant distances of POCA from ACD tile elements. After selecting for well reconstructed tracks, I split POCA into two sets: those corresponding to hit tiles, and those corresponding to unhit tiles. I then also plot the fraction of the total number of events at a given covariant distance which correspond to (un)hit tiles.
I examine the resulting distributions for POCA from both the first track and first cluster.
| Code Block | |||
|---|---|---|---|
| |||
CalTrackAngle < 0.1 #Well Reconstructed Tracks Tkr1IsHit = mipsPmtA() < 0.001 && mipsPmtB() < 0.001 | |||
| Code Block | |||
| |||
#Hit Tile Definition McTkr1DirErr < 0.1 # Track Quality Selection |
Tile 22
It appears that there are not enough statistics for Looking at an individual tile in the center of the ACD, the statistics are too limited to draw any real conclusions. However, these plots hint hit tiles tend to have POCA with negative covariant distances while the unhit POCA tend to have positive covariant distances (as expected).
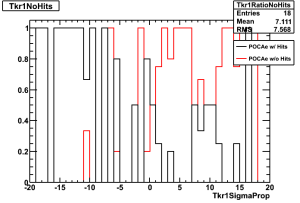
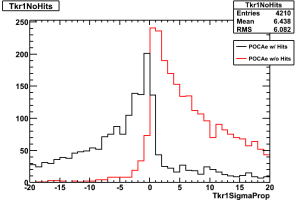
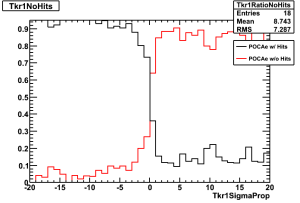
Tkr1 Raw Counts | Tkr1 Ratio of Total Counts |
|---|---|
|

Middle tiles
TileId = 11,12,13,21,22,23,31,32,33
|
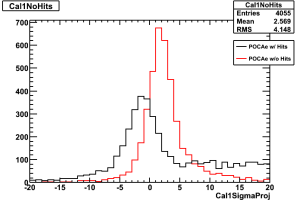
Cal1 Raw Counts | Cal1 Ratio of Total Counts |
|---|---|
|
|


Top Tiles
Taking all the top ACD tiles substantially increases the statistics. It is now clear that there is a sharp shift from hit to unhit tiles at a covariant distance of 0.
Tkr1 Raw Counts | Tkr1 Ratio of Total Counts |
|---|---|
|
Top Tiles
The plots before were slightly unfair, since they were cutting on McTkr1DirErr to select for well reconstructed tracks. Replacing this cut with a cut on CalTrackAngle we get very similar plots.
| Code Block | ||
|---|---|---|
| ||
CalTrackAngle < 0.1
|
|
Cal1 Raw Counts | Cal1 Ratio of Total Counts |
|---|---|
|
|