...
Min RTT from Pern Islamabad | Average RTT from Pern Islamabad |
|---|---|
| |
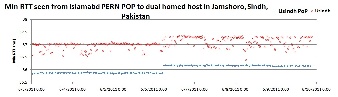
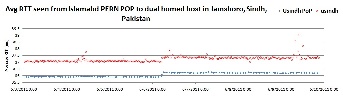
Looking at the graphs one can see that there are rapid fluctuations in the data values for each node. Because of which the graphs show a scattered plot with a number of data points above and below, which seem to be on the same point on x-axis. However looking at the spreadsheet, it is observed that two data values are collected for each half an hour, and these two values fluctuate by about 0.3 ~ 0.4 ms for PoP node while it fluctuates by 0.63ms for usndh non-PoP node. Although we don't know the reason for this fluctuation , however we know that this fluctuation is continuous for both of the nodes and for all 7 of the days.
We see that the min of min RTT for PoP was 35.827ms , avg of min RTT was 36.16402, max of min RTT was 36.48203, IQR of min RTT was 0.294 (see table for pingerjms.pern.edu.pk column 1 and 2).
...
On average there is a difference of 1.2ms 02ms in Min RTT, 1.33ms 16ms in Average RTT and 1.55ms 35ms in Max RTT for the two nodes. Usindh PoP is performing better than Usindh non-PoP node.
...