...
Going to http://www-wanmon.slac.stanford.edu/cgi-wrap/connectivity.pl?format=csv&rawdata=pinger.usindh.edu.pk&days=6&monitor=pinger.pern.edu.pk and http://www-wanmon.slac.stanford.edu/cgi-wrap/connectivity.pl?format=csv&rawdata=pingerjms.pern.edu.pk&days=6&monitor=pinger.pern.edu.pk we collected the data for past 7 days and plotted it in excel to see the curves for Average RTT and Min RTT.
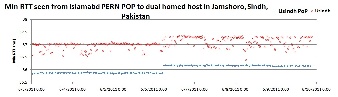
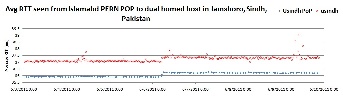
And the spreadsheet is available here.
...