...
The graphs clearly show that the PoP node performance is worse than the non-PoP node. In order to get a better insight into finding the reason of this degraded performance, we looked at the traceroutes for both of the nodes from pinger.pern.edu.pk (Islamabad Pern PoP). However, the traceroutes for both of the nodes are throwing error messages.
RTTs seen from PoP Islamabad (pinger.pern.edu.pk)
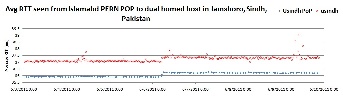
The next thing we want is to see the picture of network performance while accessing both of the nodes from one central node and not from whole of the Pakistan. For this, we chose PoP Islamabad as monitoring node and accessed Usindh (pinger.usindh.edu.pk) and Usindh PoP (pingerjms.pern.edu.pk)
Going to http://www-wanmon.slac.stanford.edu/cgi-wrap/connectivity.pl?format=csv&rawdata=pinger.usindh.edu.pk&days=6&monitor=pinger.pern.edu.pk and http://www-wanmon.slac.stanford.edu/cgi-wrap/connectivity.pl?format=csv&rawdata=pingerjms.pern.edu.pk&days=6&monitor=pinger.pern.edu.pk we collected the data for past 7 days and plotted it in excel to see the curves for Average RTT and Min RTT. 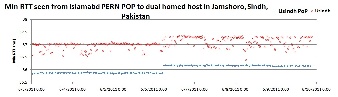
And the spreadsheet is available here.
Traceroute Results from pinger.pern.edu.pk
...