1. Introduction
School of Electrical Engineering and Computer Sciences (SEECS) , is a constituent college of National University of Sciences and Technology (NUST), Pakistan . - SEECS was formerly known as NIIT (NUST Institute of Information Technology). Since SEECS has been an important collaborator with SLAC, CERN and Caltech, we prepared a case study presenting an overview of the issues faced by SEECS in particular and Pakistan in general.
Currently the PingER project maintains eight (8) monitoring nodes in Pakistan, measuring the performance of sites listed in the table - monitored nodes - below. The measurements date back to 2003. Since then there has been a gradual increase in the number of monitoring nodes which helps in making reliable inferences. These monitoring sites are deployed in Islamabad at the following locations:
Table 1: Monitoring nodes:
Location | No. of monitoring nodes |
|---|---|
SEECS, NUST | 4 |
NCP, Quaid-e-Azam University | 1 |
COMSATS University | 1 |
Pakistan Education Research Network (PERN) | 1 |
Micronet/Nayatel Pakistan (rev.traceroute) | 1 |
Note that Pakistan Education and Research Network (PERN) "is a nationwide educational intranet connecting premiere educational and research institutions of the country. PERN focuses on collaborative research, knowledge sharing, resource sharing, and distance learning by connecting people through the use of Intranet and Internet resources". PERN uses the services of NTC (National Telecommunication Corporation), which is the national telecommunication carrier for all official/government services in Pakistan, for the provision of infrastructure and bandwidth to the universities in Pakistan.
Table 2: Monitored - Remote - NodesNodes monitored:
Remote Node | University/Organization | Service Provider | Available | End Host Location |
|---|---|---|---|---|
SDNPK (wb.sdnpk.org) | Islamabad | Cyber NET (cyber.net.pk) |
| Islamabad |
PERN (www.pern.edu.pk) | Islamabad | PERN |
| Islamabad |
LSE (lahoreschoolofeconomics.edu.pk) | Lahore |
|
| Lahore |
COMSATS (comsats.edu.pk) | Islamabad | PERN |
| Islamabad |
NAYATEL (nayatel.com) | Islamabad | Micronet/Nayatel (dsl.net.pk) | Islamabad | |
BUITMS (buitms.edu.pk) | Quetta | PERN* |
| Quetta |
SSUET (ssuet.edu.pk) | Karachi | PERN |
| Karachi |
UPESH (www.upesh.edu.pk) | Peshawar | PERN* |
| Islamabad |
PIEAS (www.pieas.edu.pk) | Nilore | PERN* |
| Islamabad |
NUST (www.niit.edu.pk) | Rawalpindi | Micronet/Nayatel (dsl.net.pk) | 1 - 1.5 Mbps | Rawalpindi |
GIKI (www.giki.edu.pk) | Topi | PERN* |
| Topi |
UET (uet.edu.pk) | Lahore | PERN |
| Lahore |
HU (hu.edu.pk) | Hazara | PERN |
| Hazara |
DSL.NET (dsl.net.pk) | Islamabad | Micronet/Nayatel (dsl.net.pk) |
| Islamabad |
* These results are not confirmed.
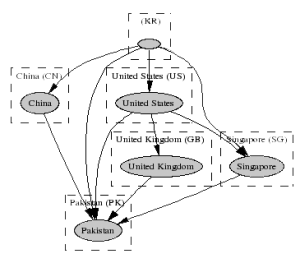
Following is Thus the coverage of PingER in Pakistan can be summarized by the following figure. The monitoring nodes are labeled red where as the monitored nodes are labeled green.
Figure 1 |
|---|
|
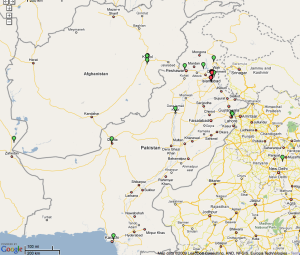
The data presented here has been collected from the monitoring sites mentioned above. A copy of the same can be obtained from here. We study and filter the results for anomalous observations and present the analysis below.
2. Routing
We first look at the International connectivity to the PingER monitored sites.
2.1. International Connectivity
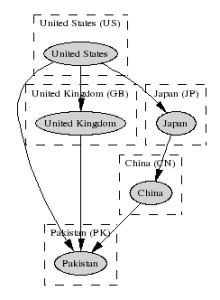
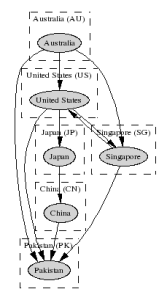
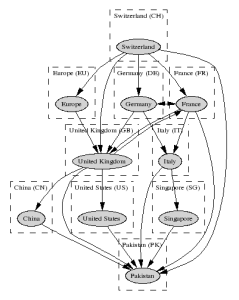
Below are the routing results we compiled using (the Route Visualizer and) the monitoring sites in North America, Australia, Europe and East Asia. These results enable us to draw the following conclusions:
- Pakistan maintains multiple routes to the world. These routes usually transit the United States, United Kingdom, Singapore and China.
Performance Results
| Wiki Markup |
|---|
Data file: \[[xls|^performance-PK-PK.xls]\] |
AvgRTT as seen from PingER | MinRTT as seen from PingER | Loss as seen from PingER | TCP Throughput as seen from PingER |
|---|---|---|---|
| | | |

- Having direct connections with United States, United Kingdom and China, provides shortest possible paths to roughly 90% of the world Internet users and resources.
- Since Pakistan is directly connected to the United States and the United Kingdom which should have a significant impact on the Round Trip Times for most of the Internet traffic. We shall see so in the statistics presented below.
Figure 2 | Figure 3 | Figure 4 | Figure 5 |
|---|---|---|---|
| | | |
2.2. Routing within Pakistan
The routing results compiled using monitoring nodes within Pakistan showed that the traffic stayed within Pakistan. The Internet Exchange Points appear to be operating as expected. This is also confirmed by the Round Trip Times discussed below. Anomalies what so ever, were not observed. The fact that the IXPs are operating as expected is a pleasant observation as compared to the past (2004) when traffic originating within Pakistan and destined for a host inside Pakistan would exit the country and transit an international carrier before reaching its destination.
3. Performance Results
Data files: Set I [xls], Set II: [xls]
Here we discuss the performance metrics as measured by the PingER monitoring hosts.
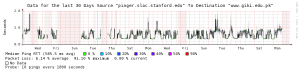
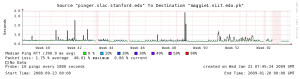
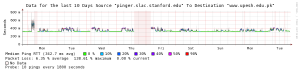
3.1. Performance as seen from SLAC
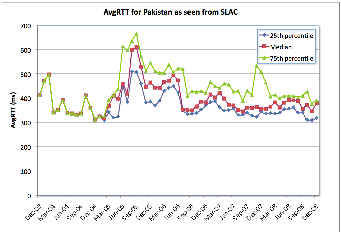
The performance measurement results for Pakistan as gathered by the monitoring node at SLAC are summarized below.
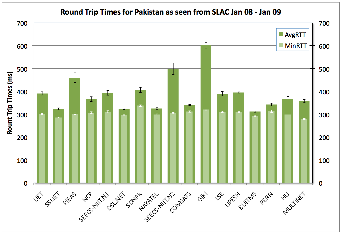
As seen in figure 6 the average RTT shows that the estimates have dropped gradually from poor (about 600 ms) to acceptable (about 350 ms). While the internet penetration was increasing in 2005, a significant increase was observed around September 2005 when the undersea cables were severed. The average RTT remained steady around 450ms untill 2006 when Pakistan acquired additional international bandwidth by via three undersea fibre links due to which we observe a drop in July 2006. Pakistan has been gradually acquiring additional bandwidth as the demand increases. As also confirmed from the routing results, Pakistan maintains at least four different routes to the world.
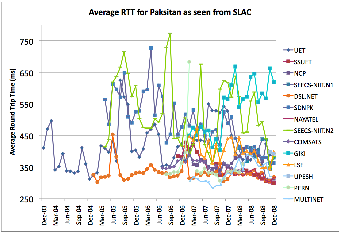
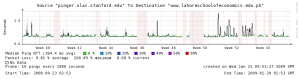
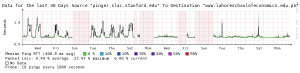
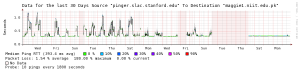
Studying the measurements to individual universities and commercial organizations within Pakistan as shown in Figures 7 and 10, we see that nearly all the institutions have either maintained their performance i.e. measurements of less than 400ms or have improved relatively over time. Except for GIKI which has been performing poorly since early 2008.
Figure 6 | Figure 7 | Figure 8 | Figure 9 |
|---|---|---|---|
| | | |
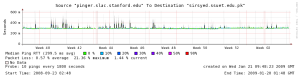
The round trip times to Pakistan have generally improved due to change of international routes, however the connectivity to the institutions has not improved in similar proportions. This is evident from the last mile effects observed in Figures 12 and 13. The increase in RTT as well as Packet Loss during the day - when people use Internet resources - is evident for all institutions except NAYATEL which is an Internet Service Provider. We identified these effects in 2006, and informal recommendations were forwarded to the concerned institutions as well as the Higher Education Commission of Pakistan. We see that SEECS-NUST has significantly improved its performance over the years, however, it still faces issues of congestion due to the last-mile effect (in other words, insufficient available bandwidth per person considering the usage at a university).
Figure 10 | Figure 11 |
|---|---|
| |
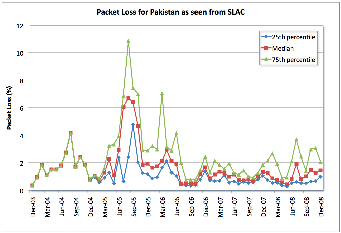
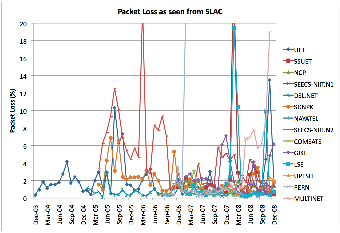
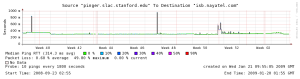
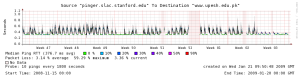
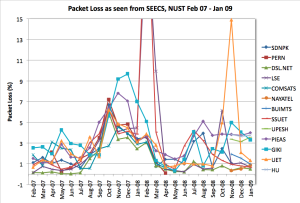
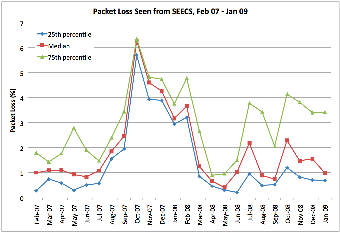
In a similar pattern, we see improvements in Packet Loss estimates as shown in Figure 8. As discussed earlier regarding Figure 7, we see improvements in Packet Loss estimates in Figure 9 for nearly all the institutions except GIKI which shows increased losses. However we see in Figure 9 and 11 that despite the improvements the packet loss estimates are not within acceptable levels. Except for SEECS-NUST , NCP-Quaid-e-Azam University, Micronet/Nayatel and PERN, all the other institutions show packet loss levels greater than 1%.
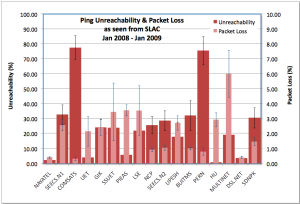
The high unreachability levels of COMSATS and PERN are due to power outages experienced at the monitored nodes. The rest of the institutes show poor unreachability levels when compared to international standards, however, the estimates can be understood in light of the power shortage faced by Pakistan.
| Figure 12 | Figure 13 |
|---|---|---|
GIKI | | |
LSE | | |
NAYATEL | |
|
SEECS,NUST | | |
SSUET | | |
UPESH |
| |
Aggregate results | | |
Aggregate results | |
Routing
...
As seen from SLAC
North America
...
As seen from AARNET
Australia
...
As seen from CERN
Switzerland
...
As seen from KHU
South Korea
|
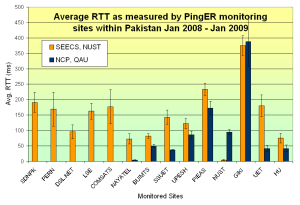
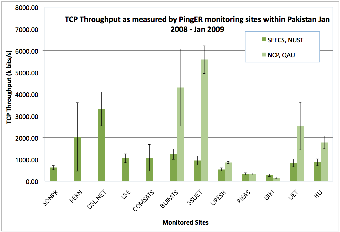
3.2. Performance within Pakistan as seen from SEECS-NUST and NCP-QAU
Figure 14 | Figure 15 | Figure 16 |
|---|---|---|
| | |
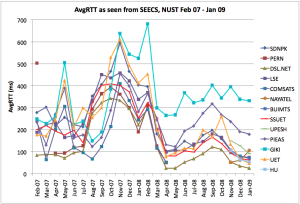
Figures 14-20 exemplify the fact we discussed earlier that even though the national backbone is well provisioned, the Internet connections to the institutions suffer from the last-mile effects. Though the AvgRTT to different institutions from NUST (Fig 14) has decreased over the years (except for GIKI and PIEAS), yet they are not within acceptable levels (i.e less than 70ms). Table 1, listing the locations of the institutes also helps in evaluating the AvgRTT results in Figure 14.
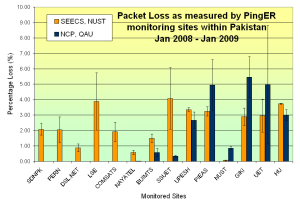
So is the case of the packet loss results shown in Figure 15. Except for Micronet/Nayatel (whose loses are due to congetion at SEECS-NUST) all institutes either show poor levels of packet losses (greater than 3%) or show huge fluctuations (such as 2% to 15% or higher). Refering back to Figures 12 and 13, these losses are primarily die to the congestion caused by the last-mile effect.
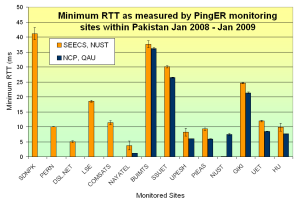
Figures 17 to 20 show the detailed comparisons of the monitored institutes. NUST, Nayatel/Micronet and NCP appear to have better provisioned setups. However, it must be noted that both NUST and NCP are customers of Micronet/Nayatel.
Figure 17 | Figure 18 | Figure 19 | Figure 20 |
|---|---|---|---|
| | | |
Conclusion & Recommendations
The fundamental observation made from this case study is that though the national backbone is well provisioned, yet the institutions do not reflect the expected levels of performance. The primary reason for this is the high user to available bandwidth ratio. Also, the power shortage in Pakistan does not help with unreachability levels.
Annexure
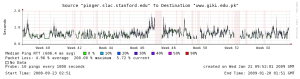
The traceroute results below show the RTT progression implying that the national backbone is well provisioned.
| No Format |
|---|
From SLAC to COMSATS
traceroute -m 30 -q 3 -f 3 203.124.40.143'
traceroute to 203.124.40.143 (203.124.40.143), 30 hops max, 38 byte packets
 3  rtr-border1-p2p-core2 (134.79.252.137)  1.545 ms  1.409 ms  1.369 ms
 4  192.68.191.245 (192.68.191.245)  0.433 ms  0.350 ms  1.397 ms
 5  sunnsdn2-slacmr1.es.net (134.55.217.2)  1.689 ms  0.594 ms  0.606 ms
Icmp checksum is wrong
 6  sunncr1-sunnsdn2.es.net (134.55.209.98)  1.948 m  0.889 ms  1.058 ms
 7  eqxsjrt1-sunncr1.es.net (134.55.220.85)  1.472 ms  2.516 ms  2.496 ms
 8  ge13-1.br02.sjo01.pccwbtn.net (206.223.116.48)  1.696 ms  2.656 ms  2.094 ms
 9  ptcl.pos11-0.cr02.hkg04.pccwbtn.net (63.218.2.126)  277.222 ms  277.752 ms  277.524 ms
10  khi-drni01-gw2.pie.net.pk (221.120.250.245)  279.790 ms  281.032 ms  279.540 ms
11  static.khi77.pie.net.pk (202.125.128.174)
      277.720 ms static.khi77.pie.net.pk (202.125.128.173)
      282.210 ms static.khi77.pie.net.pk (202.125.128.156)
      281.113 ms
12  * * *
13  rwp44.pie.net.pk (202.125.148.164)  308.943 ms 308.652 ms  310.386 ms
14  rwp44.pie.net.pk (202.125.159.210)  300.656 ms  300.619 ms  300.898 ms
15  comsats.pie.net.pk (221.120.235.170)
     307.241 ms comsats.pie.net.pk (221.120.235.166)
     303.849 ms comsats.pie.net.pk (221.120.235.170)
     307.327 ms
16  * * *

From KHU to SSUET
traceroute to 121.52.157.145 (121.52.157.145), 30 hops max, 38 byte packets
 1  163.180.116.1 (163.180.116.1)  1.765 ms  0.913 ms  0.956 ms
 2  192.168.100.30 (192.168.100.30)  0.409 ms  0.250 ms  0.248 ms
 3  163.180.190.254 (163.180.190.254)  0.807 ms  0.845 ms  0.797 ms
 4  203.255.249.162 (203.255.249.162)  0.761 ms  0.770 ms  0.791 ms
 5  192.168.77.2 (192.168.77.2)  1.364 ms  1.445 ms  1.390 ms
 6  192.168.3.9 (192.168.3.9)  1.794 ms  1.614 ms  1.466 ms
 7  61.252.48.181 (61.252.48.181)  1.418 ms  1.772 ms  1.480 ms
 8  202.179.241.81 (202.179.241.81)  38.940 ms  40.554 ms  38.841 ms
 9  sg-so-01.bb-v4.noc.tein2.net (202.179.241.14)  70.792 ms  70.885 ms  70.690 ms
10  202.179.249.46 (202.179.249.46)  277.305 ms  276.984 ms  276.916 ms
11  khi-drni01-gw2.pie.net.pk (221.120.250.245)  279.257 ms  277.627 ms  278.032 ms
12  hi77c2-Sw494b.pie.net.pk (202.125.128.134)  279.787 ms  279.693 ms  280.300 ms
13  * * *
14  khi77.pie.net.pk (202.125.137.154)
      290.099 ms khi77.pie.net.pk (202.125.137.158)
      282.534 ms khi77.pie.net.pk (202.125.137.154)
      300.919 ms
15  * * *
16  121.52.157.145.pern.pk (121.52.157.145)  288.338 ms  295.533 ms  295.273 ms

From KHU to SEECS
traceroute to 115.186.131.82 (115.186.131.82), 30 hops max, 38 byte packets
 1  163.180.116.1 (163.180.116.1)  0.859 ms  0.830 ms  0.952 ms
 2  192.168.100.30 (192.168.100.30)  0.286 ms  0.262 ms  0.240 ms
 3  163.180.190.254 (163.180.190.254)  1.034 ms  0.815 ms  0.741 ms
 4  221.147.177.41 (221.147.177.41)  1.116 ms  1.534 ms  1.110 ms
 5  221.163.40.70 (221.163.40.70)  2.791 ms  2.996 ms  2.659 ms
 6  221.163.40.65 (221.163.40.65)  1.235 ms  1.265 ms  1.237 ms
 7  220.78.135.177 (220.78.135.177)  1.768 ms  1.376 ms  1.282 ms
 8  220.73.149.153 (220.73.149.153)  2.496 ms  1.920 ms  1.924 ms
 9  59.18.52.26 (59.18.52.26)  1.682 ms  1.688 ms  1.747 ms
10  59.18.63.34 (59.18.63.34)  2.070 ms  1.960 ms  2.016 ms
11  pos5-2.cr01.tok01.pccwbtn.net (63.218.147.17)  32.891 ms  32.668 ms  32.814 ms
12  pos12-1.cr02.hkg04.pccwbtn.net (63.218.146.50)  69.368 ms  68.813 ms  68.774 ms
13  ptcl.pos11-0.cr02.hkg04.pccwbtn.net (63.218.2.126)  312.585 ms  312.865 ms  312.720 ms
14  khi-drni01-gw2.pie.net.pk (221.120.250.245)  311.026 ms  314.919 ms  310.949 ms
15  static.khi77.pie.net.pk (202.125.128.174)  313.425 ms  313.562 ms  314.118 ms
16  rwp44.pie.net.pk (221.120.254.5)  336.111 ms  335.974 ms  336.116 ms
17  rwp44.pie.net.pk (202.125.148.164)  336.796 ms  336.971 ms  336.663 ms
18  rwp44.pie.net.pk (202.125.155.170)  333.485 ms  333.120 ms  333.553 ms
19  Onyx.rwp44d2.pie.net.pk (202.125.155.122)  338.855 ms  338.722 ms  338.572 ms
20  58-65-175-221.nayatel.pk (58.65.175.221)
      360.480 ms 58-65-175-217.nayatel.pk (58.65.175.217)
      354.434 ms 58-65-175-221.nayatel.pk (58.65.175.221)
      360.170 ms
21  58-65-175-233.nayatel.pk (58.65.175.233)  354.897 ms  354.896 ms  354.688 ms
22  115-186-128-178.nayatel.pk (115.186.128.178)  368.485 ms  365.507 ms  365.828 ms
23  115-186-131-82.nayatel.pk (115.186.131.82)  358.111 ms !<10>  357.391 ms !<10>  357.530 ms !<10>
|
...
...
...
...