...
For Portugal there are two small spikes around 3/11-3/12 and 3/16 and then a big spike in IPDV between 3/28/20 and 4/1/20. On Mar 12 Portugal declared the highest level of alert following community transmission and on Mar 13th the total number cases exceeded 100. On Mar 31st the first death was announced. Also for Portugal see https://www.politico.eu/article/how-portugal-became-europes-coronavirus-exception/#%20European%20response%20to%20deaths
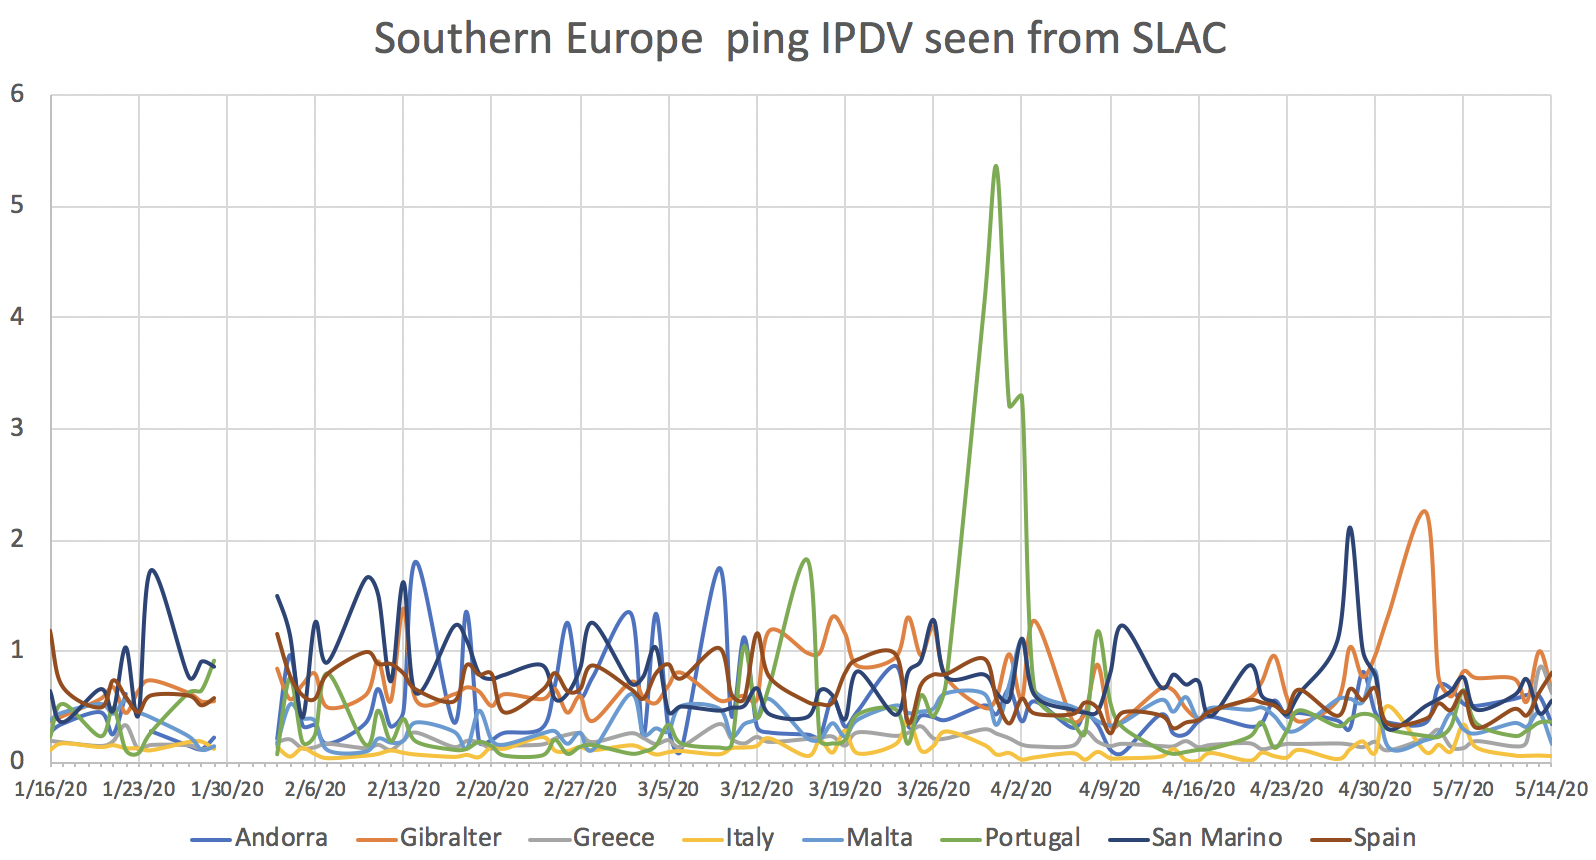
However when one looks at alldays instead of just weekdays the peak at 3/13/2020 does not look as prominent.Thus we are left with just the peak at the end of March and the start of April:
...
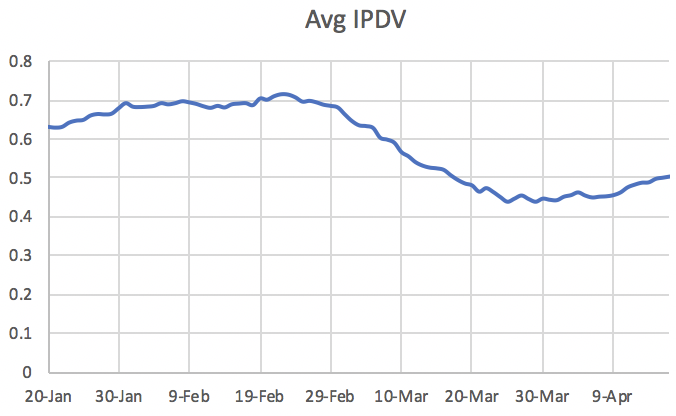
Also if one takes a window of 31 days and in that window calculate the average IPDV for those 31 days then starting the window on Jan 20th, 2020 and sliding it foward forward one day at a time until the window's last day is May 17th, 2020, one gets the chart below. In this chart it is seen that the 31-da, window average IPDV drops from about 0.7msec (window starts 29-Feb) to about 0.45msec (window starts April 2nd), This represents a drop of about 50% centered around the time of the interventions in Spain. There is an Excel spread sheet for this data.
PingER monitors 4 hosts in Spain. Two https://www.slac.stanford.edu and http://www.uam.es are connected to SLAC via the high-performance research networks ESnet, GARR and REDIRIS. A third, speedtest.servihosting.es, is a network speed testing host. The fourth, www.ipv6tf.org is an IPV6 host.
...
Note that there are 6 Italian hosts monitored. Five are part of INFN and are connected by high-speed networks including ESnet, GEANT, and GARR. The other is speed.unidata.it, a Speedtest host (http://speed.unidata.it/speedtest/upload.php). Thus the hosts are not very representative of commercial connections to public hosts.