...
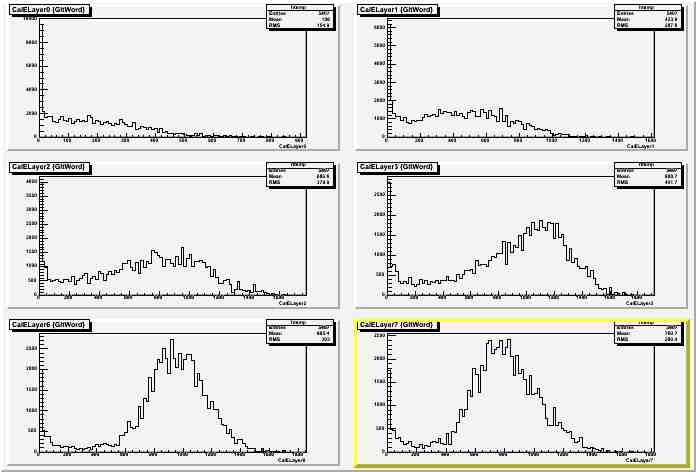
indicates that the satellite peaks are uncorrelated. These plots look like the biggest clue. The layer energies, aside from zero, are all wrong, as seen from the last pre-new-CAL release (v6r2p8) (Merit tuple from systests 10 GeV gammas; GltWord>0):
For comparison, here are more plots from v6r2p8:
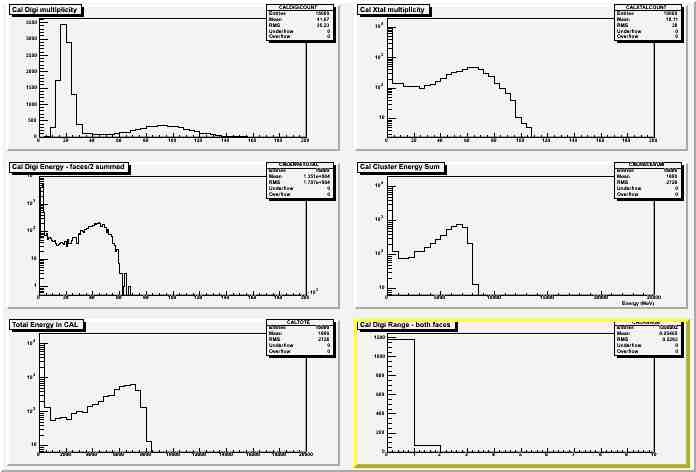
I did not filter out non-triggered events, so you'll need to eyeball log plots. Note the ranges are a little different. No gap between 1 and 3. Actually on a log plot there are a few instances of 2.
Addendum 3/8/2006 (RXD)
The odd energy bumps are caused by individual hits:
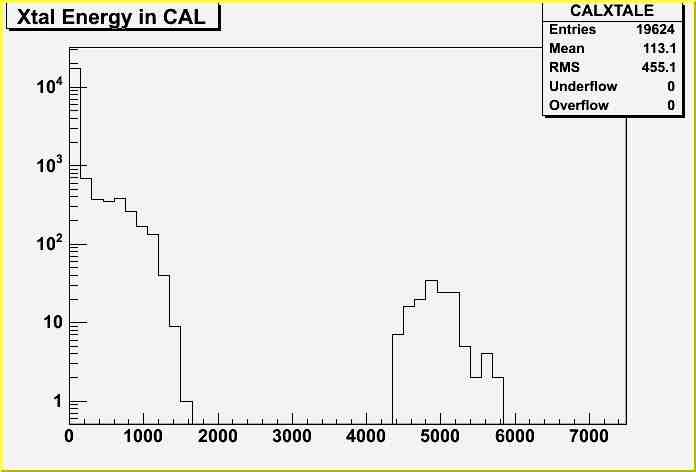
and if I print out some of the 'bogus' hits from CalXtalRecData, I see
| No Format |
|---|
twr, lyr, col = 4 6 11 range 1 ph0 4770.56 E 4770.56
twr, lyr, col = 0 7 0 range 1 ph0 5170.28 E 5170.28
twr, lyr, col = 3 5 9 range 1 ph0 4888.91 E 4888.91
twr, lyr, col = 13 5 6 range 1 ph0 4576.14 E 4576.14
twr, lyr, col = 9 6 1 range 1 ph0 4438.02 E 4438.02
|
If I did this correctly all these baddies are range 1, and I assume maxed out. This may explain the deficit of range 2 crystals. And maybe some effect for getting range 3.
If I exclude hits with energies > 2 GeV, the energy sums look normal.
The plots and printout were done with:
| No Format |
|---|
    CalRecon *calRec = rec->getCalRecon();

    if (!calRec) return;

    TObjArray*  xtalCol = calRec->getCalXtalRecCol();
    Long64_t numXtal = xtalCol->GetEntries();
    ((TH1F*)GetObjectPtr("CALXTALCOUNT"))->Fill((Float_t)numXtal);
    float totXE = 0.;
    for (int xc=0;xc<numXtal; xc++) {
      CalXtalRecData* xtal = (CalXtalRecData*)xtalCol->At(xc);
      float xtalEnergy = xtal->getEnergy();
      ((TH1F*)GetObjectPtr("CALXTALE"))->Fill(xtalEnergy);
      if (xtalEnergy > 2000) {
	CalXtalId id = xtal->getPackedId();
	int lyr = id.getLayer();
	int twr = id.getTower();
	int col = id.getColumn();
	CalRangeRecData* rData = xtal->getRangeRecData(0);
	int range = rData->getRange(0);
	double ph0 = xtal->getEnergySelectedRange(range,0);
	std::cout << "twr, lyr, col = " << twr << " " << lyr << " " << col <<
	  " range " << range << " ph0 " << ph0 << " E " << xtalEnergy << std::endl;

	continue;
      }
      totXE += xtalEnergy;
    }
    ((TH1F*)GetObjectPtr("CALXTALTOTE"))->Fill(totXE);
|
Addendum 3/9/2005 (BG)
Looking at the sum of the reconstructed deposited energy in the CAL divided by the sum of the MC deposited energy, vs the sum of the MC deposited energy, there are
a set of different populations. It is also clear that the effect doesn't set in before some energy level.
Now the same plot but showing the individual CDE Recon energy versus its MC energy. There is indeed a population of CDEs contributing in a strange but linear way. This can happen for more than 1 CDE per event.
To see if there is a particular set of CDEs that are the cause of this, this is a histogram with the number of occurencies where CDE #(96*twr+12*lyr+col) has E(recon)-E(MC)>1 GeV. All CDEs can be triggered by this effect, it seems to be only a function of MC energy.
Now cutting on those weird events it is visible that E(recon)-E(MC) = 4*E(MC) when it happens.