...
Johari at UNIMAS has installed two monitoring hosts: pinger.unimas.my and pinger2.unimas.my. See here for hardware specs of two hosts.
Joahri can you add a table or something describing the hosts (OS, CPU etc.) and where they are located (at border, internally behind n routers etc.)
...
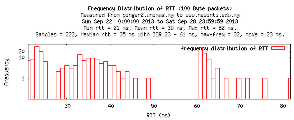
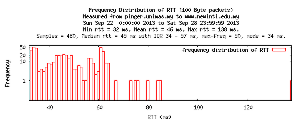
Time in msec. | Minimum RTT | Maximum RTT | Median RTT | IQR | Max frequency | Mode |
|---|---|---|---|---|---|---|
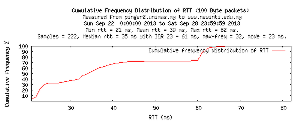
pinger (N4) | 21 | 82 | 45 | 24-57 | 50 | 34 |
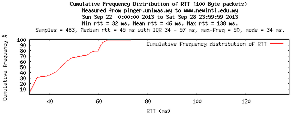
pinger2 (RASPBERRY) | 32 | 165 | 35 | 23-61 | 32 | 23 |
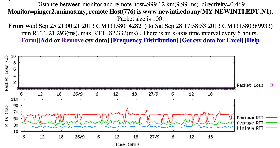
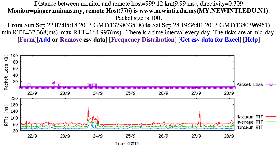
The time series and distributions are shown below:
| www.newinti.edu.my seen from pinger2 (Raspberry) | www.newinti.edu.my seen from pinger(N4 |
|---|---|---|
Loss and RTTs (msec) |
|
|
Frequency Distributions |
|
|
Cumulative Frequency Distributions |
|
|
We also used PingER (pingtable.pl) with 100 byte pings to look at the average RTTs from the two UNIMAS monitoring hosts to remotes sites in Malaysia. This was downloaded into Excel, a spreadsheet was created and Excel used to analyze the data and create histograms, see below.
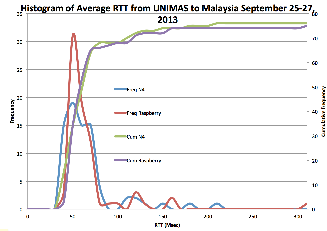
There is more difference in this case, however whether it is statistically significant needs more data and further analysis.
Reliabillity
After deploying the Raspberry Pi in the Computer Center at UNIMAS, Johari ran into reliability problems due to the power connector coming loose. Duct tape did not fix it since the heat of the Raspberry Pi melted the glue. Johari got a replacement and will configure and try agin.