...
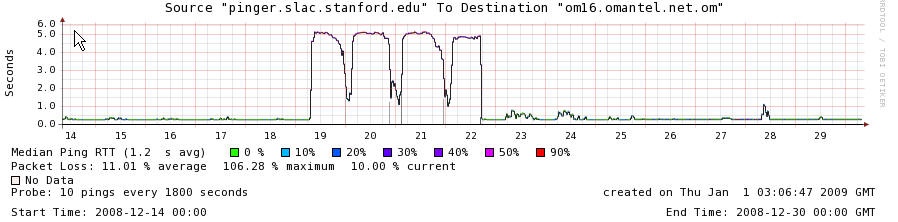
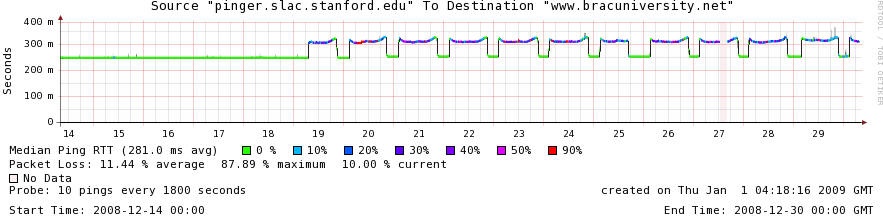
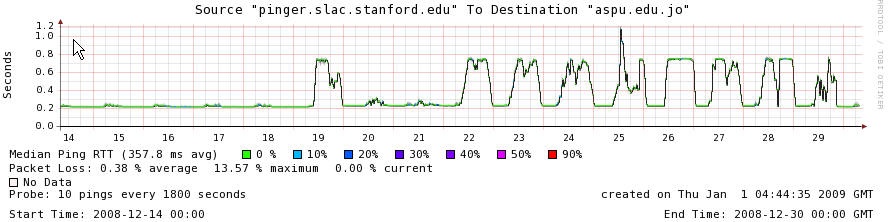
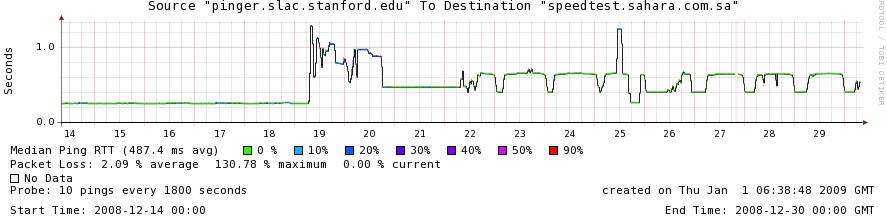
Probably the most dynamic way to show the effects is to use the PingER Metrics Motion Charts for the regions most badly affected, : Middle East, South Asia an d and Africa (Egypt and Libya). These show the variation of multiple metrics as a function of time. To assist in this we have captured the charts for 21 days starting December 14th 2008. The charts for the three regions are shown below. To view them, for example, click on the Africa thumbnail, then click on the right arrow to play the data. After viewing this, select the size metric (by default to be Population (#)) to be Packet Loss (%). Under Select choose the country of interest to be trailed (e.g. Egypt), then click on the arrow to playback the performance of the throughput, the average RTT and packet loss all the while trailing the bubble for Egypt. Note the dramatic change in increase of loss (bubble size), and average RTT starting on December 19th, and the recovery after December 22nd. The effect is more dramatic if one chooses a log scale for the x axis (Packet Loss (%)).
Africa | Middle East | South Asia |
|---|---|---|
| | |


...
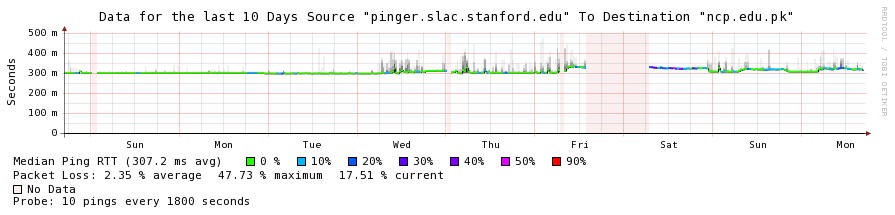
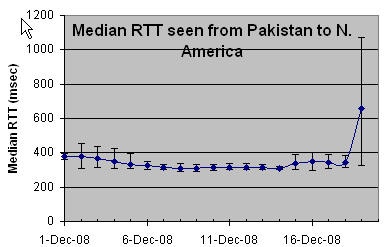
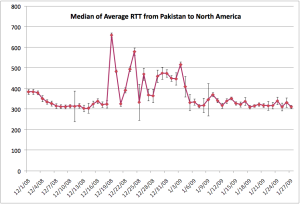
Another view of the effect of the RTT increases is seen in the plot below of the median RTTs measured (thed error bars are the 25% and 75%-tiles) from 3 monitoring hosts in Pakistan (NUST, COMSATS and NCP) to FNAL and SLAC (i.e. 6 pairs of monitor/remote hosts) for the first 19 days of December 2008.
Median RTT | Median of AvgRTT from Pakistan to North America |
|---|---|
| |
Jitter
We measure the jitter as the Inter Packet Delay Variability (IPDV) (see Tutorial). The plots below show the RTT and Loss plus the IPDV and maximum and minimum (of 10 pings) measured for a host (Sudan University of Science and Technology (SUSTECH)) in the Sudan. The dramatic increases in RTT, jiiter and losses are clearly seen foillowing the December 19th cable cuts. The graph on the right shows the drop in throughput derived from the average RTTs and losses as:
...
- Information on Submarine Communications
- 2008 Submarine Cable Disruption from Wikipedia.
- Mediterranean Fibre Cable Cut: A RIPE NCC Analysis, February 2008
- Mother Earth Mother Board, Neal Stephenson, Wired, all about the laying of the longest underwater telephony cable in history. Stephenson goes into a lot of details as to how the cable is laid, what happens to the cable when it reaches shore, what is the cable made of, how does it work, how it is repaired etc.
- From Harvey Newman, Caltech:;
unmigrated-wiki-markup
Interestingly, however, the current (Nov. 2008) issue of the newsletter \ [Submarine Telecoms Forum\], in addition to an article on the use of subsea cables for monitoring compliance to the International Nuclear Test Ban Treaty, features a story on _Navy Undersea Cable Systems_ on Page 34. The entire issue can be found here:[http://www.subtelforum.com/issues/WFN_41.pdf].Also give a look at the cable ship sighting section on Page 54 where you'll find _A Global Guide to the Latest Known Locations of the World's Cable Ships_ as of May 2008, as provided by Lloyds List.And for those interested in how subsea cables are upgraded to higher throughput rates, see Same Pipes, Faster Speed, by Andy Lumsden on p. 3838.
- The following quote from Telegeography on April 11, 2011 is also interesting concerning by-passing the effects of such outages in future.
Carriers face a different challenge in Egypt. Egypt serves a pivotal role in international connectivity, because all undersea cables between Europe and Asia transit the country. Carriers have been seeking to introduce five undersea cable systems connected to and across Egypt to meet burgeoning capacity requirements in the Middle East, East Africa, and India, but have been delayed for over a year by regulatory problems in Egypt. This has left carriers scrambling to identify alternative routes.
A variety of new projects have emerged that seek to provide terrestrial connectivity directly to Middle Eastern countries. In 2010 a consortium of carriers launched the Jeddah-Amman-Damascus-Istanbul (JADI) network, which links Saudi Arabia and Turkey via Jordan and Syria. Another group has plans for the Regional Cable Network (RCN), which will link the UAE to Turkey via Saudi Arabia, Jordan and Syria. The recently-unveiled Europe Persia Express Gateway (EPEG) project hopes to connect Germany to Oman via Russia and Iran by 2012 through a mix of terrestrial and undersea segments. While the planned undersea cables in Egypt will ultimately be completed, the development of new terrestrial options will further enhance the reliability of the global network.