...
We loaded the two pingtable metrics into an Excel spreadsheet (also spreadsheet with bubbles ) and used the Excel vlookup function to get the 2 metrics for each pair of hosts (monitor-remote host pairs). We then scatter plotted alpha (y) versus min_RTT (x in msec). This is shown in the plot below:
Alpha vs min_RTT | Bubble area = distance between monitor & remote |
|---|---|
| |
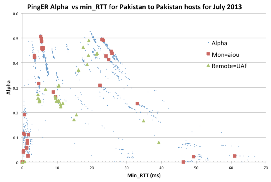
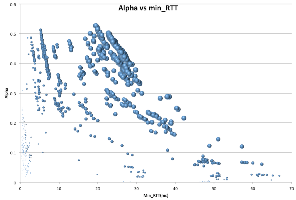
The red dots are the points for monitor AIOU, the green dots are for the remote UAF. The downward sloping lines are for monitor-remote hosts separated by roughly the same distance, e.g. monitors and remotes in Karachi and Lahore.
This routing will significantly affect the TULIP results for Pakistan and we will need to take the topological information into account in some form. Thus we will need to have a look at the PERN Deployment map. It will give you an idea of indirect routes. For example:
- The route from Islamabad to Faisalabad is through Lahore. Direct distance is around 240km. Routing distance is more than 400km.
- On the other hand, lahore to faisalabad is direct route.
- Similarly, Quetta has indirect routes through Karachi.
...
- .
Results
It is seen that:
- the maximum alpha is < 0.55.
- for min-RTT > 3 msec and < 25msec the minimum alpha is ~ 0.12.
...