...
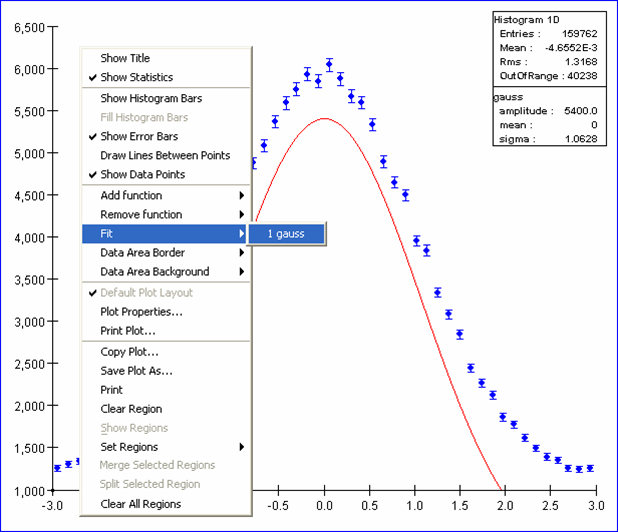
To perfom the fit right click on the plot and under the Fit menu item select the function to be fitted (if multiple functions are present on the plot it is possible to choose which one to fit).
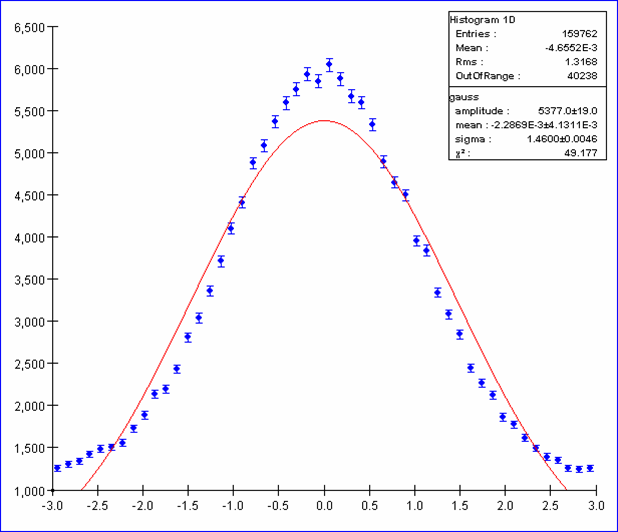
Once the fit has been performed the statistics box will show the error on the fitted parameters and the chi square of the fit. In the figure below we have a pretty bad fit; the plot is showing the sum of two gaussians so we should now try to add the second one, add the two functions together, fix the two means and fit again.
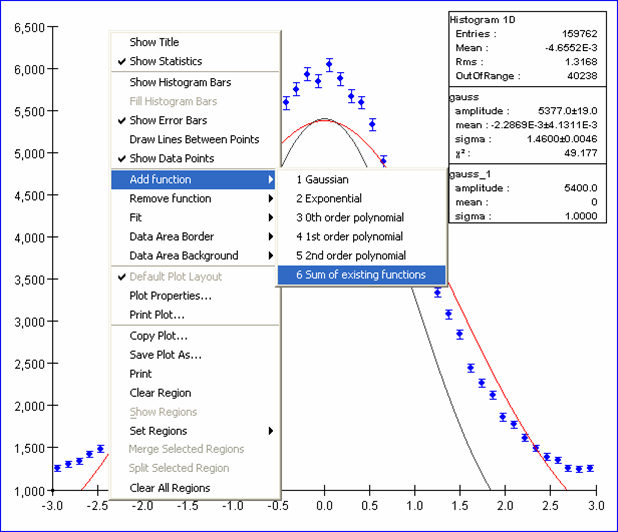
Once the second gaussian has been added to sum the two together select Sum of existing functions under the Add Function menu item on the popup menu as shown below:
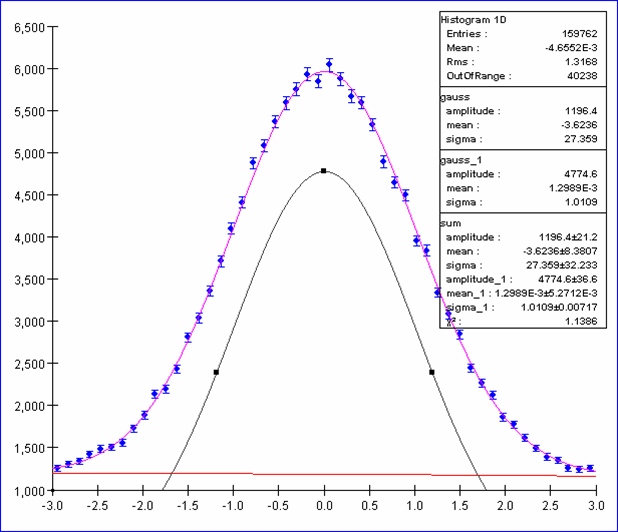
In the plot below the sum of the two gaussians is shown in magenta:
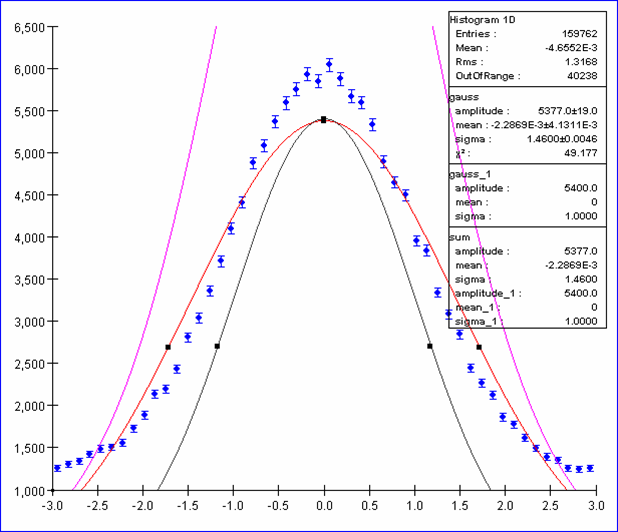
The result of the fit is now pretty good as shown below.
Configuring The Fit
Through the Plot Properties dialog it is possible to configure the fit; by selecting the Plot Properties menu item on the plot's popup menu a dialog box will appear. Select the Functions tab and on the left select the function that needs to be configured. In the picture below the sum of the two gaussians has been selected:
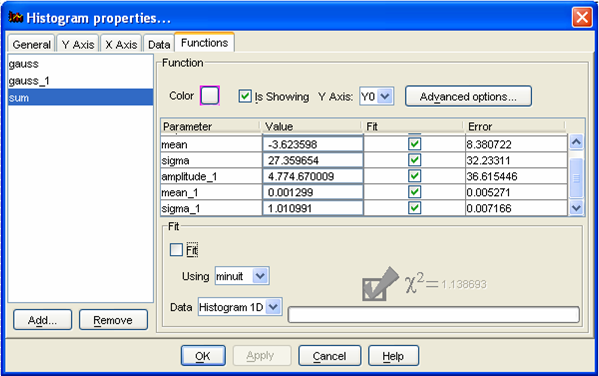
Through this dialog it is possible to choose which optimizer engine is used in the fit, control the parameters value and also fixing them by unchecking the appropriate checkbox under the Fit column next to the parameter's name.
If the Fit checkbox in the lower part of the dialog is unchecked (like in the picture above) it meas that the fit has not been performed (or that the parameters have been changed). To perform the fit just click on it. The status bar should show the progress of the fit. When finished the chi squared of the fit should be provided.