Motivation
Pinger data explorer is primarily used to visualize the trends in the Internet end-to-end performance statistics measured over 200 170 countries from +90 active PingER monitoring hosts. Having gathered data since 1998, the explorer graphs enable the users to study the trends, step changes, significant improvements/degradations.
The data can be viewed in 4 different ways: Motion bubble chart, Motion Map, Motion Histogram and Line Chart.
The different sets of charts (w.r.t. regions) enables the users to study the progress made by countries in comparison to their neighbours as well as the world in general.
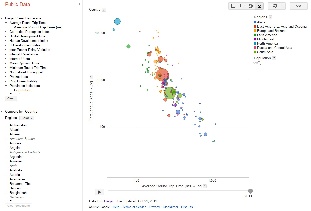
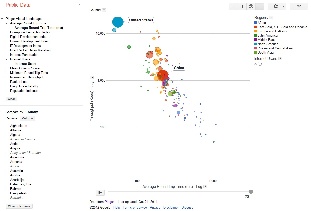
Below are some examples of the Motion bubble chart:
Default view | Highlighted countries with |
|---|---|
| |


Usage
By default the pinger data explorer shows the bubble chart between throughput in log scale to average_rtt in log scale. Each bubble represents a country. The size of the bubble shows population of the country. The color of the bubble shows the region of the country. The motion is the time. The time granularity is by the year. Click on the play button to initiate motion.
- On the left, there are two panels: PingER Visual Landscape and Compare by Country
- PingER Visual Landscape shows the metrics which are measured by PingER and which can be compared to other metrics or indices of the world.
- Click on a metric name, a sub heading of the metric will appear. Click the sub heading, a menu will open which will allow you to choose the metric to be displayed at X-axis, Y axis; or to color the bubbles on the basis of this metric; or to size the bubbles on the basis of this metric.
- To change the metric represented by the size of the bubble use the 'size' combo box to the right of the chart.
- Click on the pull down box of an axis' label to change the metric that is displayed on an axis or in a table. Other PingER metrics that are available include minimum_rtt, ipdv, packet_loss, internet users, population, n throughput, MOS and unreachability.
- Move the mouse over a bubble to identify the values for the bubble.
- Linear or logarithmic scales may be selected using the combo box along the axis.
- Move the mouse over a colored legend symbol to blink the bubbles associated with the symbol's color.
- To follow the changes in detail simply move the slider bar with the mouse.
- One can select a bubble by clicking on it to provide a label for the bubble that persists with the motion. The trails check box leaves a trail to follow the motion of selected bubbles. N.B. selected bubbles determine how far the data to be displayed goes back in time.
- By clicking the link at the right top of the page, one may select the vantage point, the observed region and the granularity of the measurements.
Implementation Details
HTML Output
To create a motion chart, the data must be populated in a data structure (as stated by Google public data explorer and copied below):
- , Ping unreachability, Corruption Perception Index (CPI), Digital Opportunity Index (DOI), Human Development Index (HDI), ICT Development Index (IDI) and internet penetration index.
- A log scale or a linear scale can be chosen for X and Y axis by going to the chart options (top right), a drop down menu appears which allows you to select default colors; allows you to set same bubble size for all bubbles; and allows you to show the trails.
- The lower left panel allows you to compare countries within a selected region or with all the countries of the world.
- In the lower left panel, below compare by country, and next to regions there is a drop down menu of colors. This allows you to choose countries to be compared in a region or with all the regions; and also allows you to color the bubbles according to regions. By default it is set to compare all the countries of the world.
- Move the cursor over a bubble to identify the values for the bubble.
- Move the cursor over a colored legend symbol to blink the bubbles associated with the symbol's color.
- To follow the changes in detail simply move the slider bar with the mouse.
- One can select a bubble by clicking on it to provide a label for the bubble that persists with the motion. The trails check box leaves a trail to follow the motion of selected bubbles.
- By clicking the link at the right top of the page, one may select the vantage point, the observed region and the granularity of the measurements.
- Only one axis (or metric) can be chosen for Motion map, Motion histogram and Line chart. Line chart requires countries of interest to be selected to view the line chart of that metric with respect to years as it does not have motion feature.
Implementation Details
HTML Output
To create a motion chart, the data must be populated in a data structure (as stated by Google public data explorer and copied below, the complete dataset can be found here ):
| Code Block |
|---|
<?xml version="1.0" encoding="UTF-8"?>
<dspl xmlns="http://schemas.google.com/dspl/2010"
xmlns:geo="http |
| Code Block |
<?xml version="1.0" encoding="UTF-8"?> <dspl xmlns="http://schemas.google.com/dspl/2010" xmlns:geo="http://www.google.com/publicdata/dataset/google/geo" xmlns:geo_usa="http://www.google.com/publicdata/dataset/google/geo" xmlns:geo_usa="http://www.google.com/publicdata/dataset/google/geo/us" xmlns:time="http://www.google.com/publicdata/dataset/google/time" xmlns:quantity="http://www.google.com/publicdata/dataset/google/quantity" xmlns:entity="http://www.google.com/publicdata/dataset/google/entity"> <import namespace="http://www.google.com/publicdata/dataset/google/time"/> <import namespace="http://www.google.com/publicdata/dataset/google/quantity"/> <import namespace="http://www.google.com/publicdata/dataset/google/entity"/> <import namespace="http://www.google.com/publicdata/dataset/google/geo"/> <info> <name> <value>Pinger Visual Landscape</value> </name> <description> <value>Some very interesting statistics about countries and their connectivity</value> </description> <url> <value>http://www-iepm.slac.stanford.edu/pinger/</value> </url> </info> <provider> <name> <value>Pinger</value> </name> <url> <value>http://www-iepm.slac.stanford.edu/pinger/</value> </url> </provider> <topics> <topic id="geography"> <info> <name><value>Geography</value></name> </info> </topic> <topic id="population_indicators"> <info> <name><value>Population indicators</value></name> </info> </topic> <topic id="pinger"> <info> <name><value>Pinger Metrics</value></name> </info> </topic> <topic id="ipdv_indicators"> <info> <name><value>Inter Packet Delay Variation</value></name> </info> </topic> <topic id="minimum_rtt_indicators"> <info> <name><value>Minimum Round Trip Time</value></name> </info> </topic> . . . . . </topics> <concepts> <!-- As noted in the tutorial, this concept should extend quantity:amount.--> <concept id="population"> <info> <name> <value>Population</value> </name> <description> <value>Size of the resident population.</value> </description> </info> <topic ref="population_indicators"/> <type ref="integer"/> </concept> <concept id="ipdv"> <info> <name> <value>ipdv</value> </name> <description> <value>Inter Packet Delay Variation</value> </description> </info> <topic ref="ipdv_indicators"/> <type ref="float"/> </concept> . . . . . <!-- This country concept is defined for educational purposes only. A country concept exists in the Google geo dataset. See: http://code.google.com/apis/publicdata/docs/canonical/geo.html --> <concept id="region" extends="geo:location"> <info> <name> <value>Regions</value> </name> <description> <value>My list of Regions</value> </description> </info> <type ref="string"/> <property id="name"> <info> <name><value xml:lang="en">Regions</value></name> <description> <value xml:lang="en">The official name of the region</value> </description> </info> <type ref="string"/> </property> <table ref="region_table"/> </concept> <concept id="country" extends="geo:location"> <info> <name> <value>Country</value> </name> <description> <value>My list of countries</value> </description> </info> <type ref="string"/> <property id="name"> <info> <name><value xml:lang="en">Country name</value></name> <description> <value xml:lang="en">The official name of the country</value> </description> </info> <type ref="string"/> </property> <property concept="region"> <info> <name><value xml:lang="en">Regions</value></name> </info> </property> <table ref="countries_table"/> </concept> <concept id="unemployment_rate" extends="quantity:rate"> <info> <name> <value>unemployment rate</value> </name> <description> <value>The percent of the labor force that is unemployed, not seasonally adjusted.</value> </description> <url><value>http://www.bls.gov/cps/cps_htgm.htm</value></url> </info> <topic ref="population_indicators"/> <type ref="float"/> <attribute id="is_percentage"> <type ref="boolean"/> <value>true</value> </attribute> </concept> </concepts> <slices> <slice id="countries_slice"> <dimension concept="country"/> <dimension concept="time:year"/> <metric concept="population"/> <metric concept="average_rtt"/> <metric concept="ipdv"/> <metric concept="minimum_rtt"/> <metric concept="MOS"/> <metric concept="nthroughput"/> <metric concept="throughput"/> <metric concept="unreachability"/> <metric concept="packet_loss"/> <metric concept="internetusers"/> <table ref="countries_slice_population_table"/> </slice> </slices> <tables> <table id="countries_table"> <column id="country" type="string"/> <column id="name" type="string"/> <column id="latitude" type="float"/> <column id="longitude" type="float"/> <column id="region" type="string"/> <data> <file format="csv" encoding="utf-8">countries.csv</file> </data> </table> <table id="region_table"> <column id="region" type="string" /> <column id="name" type="string" /> <column id="latitude" type="float" /> <column id="longitude" type="float" /> <data> <file format="csv" encoding="utf-8">countries-regions.csv</file> </data> </table> <table id="countries_slice_population_table"> <column id="country" type="string"/> <column id="year" type="date" format="yyyy"/> <column id="population" type="integer"/> <column id="average_rtt" type="float"/> <column id="ipdv" type="float"/> <column id="minimum_rtt" type="float"/> <column id="MOS" type="float"/> <column id="nthroughput" type="float"/> <column id="throughput" type="float"/> <column id="unreachability" type="float"/> <column id="packet_loss" type="float"/> <column id="internetusers" type="float"/> <data> <file format="csv" encoding="utf-8">file.csv</file> </data> </table> </tables> </dspl> |
...
- The column headings in the first line of the data file must exactly match the concept id and the property id of the concept with which the data is associated (though order may vary).
- Each row must have exactly the same number of elements as the number of properties on the concept (even if the value is empty).
- Each value for the concept's id field (here, the country code) must be unique and non-empty (an empty field is one with zero or only whitespace characters).
- Values for properties that reference other concepts must either be empty or be a valid value of the referenced concept.
- Values that contain the comma character must be represented without comma; for example 23,400 must be represented as 23400.
Relevant Files
Two scripts have to be run for generating the data file in the format required by the google data explorer. First script is generate-metric-files-for-explorer.pl . This script takes metric values from prmout folder and transposes the data such that years are now incremented vertically and not horizontally. The files generated by generate-metric-files-for-explorer.pl are then given as an input to the script generate-alldata-for-pinger-data-explorer.pl, which outputs the data for all the metrics altogether in one file named file.csv. This file is in the format as required by the google data explorer.
The metric files placed in prmout, for example, average_rtt-EDU.SLAC.STANFORD.N3-country-allyearly.csv have the data in the format shown below:
| Code Block |
|---|
allyearly,?,1998,1999,2000,2001,2002,2003,2004,2005,2006,2007,2008,2009,2010,2011
EDU.SLAC.STANFORD.N3-to-Afghanistan,.,.,.,.,.,.,.,.,.,.,767.453,732.841,728.492,750.940,743.080
EDU.SLAC.STANFORD.N3-to-Albania,.,.,.,.,.,.,.,.,.,.,.,234.933,235.681,254.324,225.474
EDU.SLAC.STANFORD.N3-to-Algeria,.,.,.,.,.,.,.,.,197.772,271.337,354.233,242.616,369.479,224.162,239.514
EDU.SLAC.STANFORD.N3-to-Andorra,.,.,.,.,.,.,.,.,.,.,171.471,166.487,172.334,180.878,181.307
EDU.SLAC.STANFORD.N3-to-Angola,.,.,.,.,.,.,.,.,.,622.280,610.272,642.821,556.701,617.649,.
EDU.SLAC.STANFORD.N3-to-Argentina,.,.,.,.,.,.,.,.,.,210.563,196.282,269.567,284.886,285.094,310.711
EDU.SLAC.STANFORD.N3-to-Armenia,.,.,.,.,.,.,553.942,433.564,590.536,613.230,532.564,370.588,255.761,248.554,237.400
EDU.SLAC.STANFORD.N3-to-Australia,.,.,.,.,.,.,.,.,.,211.440,193.981,180.105,181.620,190.176,179.072
EDU.SLAC.STANFORD.N3-to-Austria,.,.,.,.,.,.,.,.,.,.,180.361,185.830,178.831,180.726,180.207
EDU.SLAC.STANFORD.N3-to-Azerbaijan,.,.,.,.,.,.,.,.,.,.,.,257.763,269.463,256.694,252.713
EDU.SLAC.STANFORD.N3-to-Bahamas,.,.,.,.,.,.,.,.,.,.,.,109.626,110.701,817.097,112.252
EDU.SLAC.STANFORD.N3-to-Bahrain,.,.,.,.,.,.,.,.,.,.,664.547,333.670,316.139,313.444,295.960
EDU.SLAC.STANFORD.N3-to-Bangladesh,.,.,.,.,.,1562.224,1222.391,1039.782,1084.855,842.794,545.756,496.707,426.840,350.780,371.552
EDU.SLAC.STANFORD.N3-to-Belarus,.,.,.,.,.,.,1770.143,2322.474,227.052,206.936,205.880,222.485,258.829,281.173,205.689
EDU.SLAC.STANFORD.N3-to-Belgium,.,.,.,.,.,.,.,.,.,.,158.697,160.445,158.798,164.117,160.686
EDU.SLAC.STANFORD.N3-to-Benin,.,.,.,.,.,.,.,.,417.760,535.608,382.265,366.215,485.181,377.928,331.121
EDU.SLAC.STANFORD.N3-to-Bhutan,.,.,.,.,.,.,.,.,.,.,.,622.936,356.257,327.709,332.479
EDU.SLAC.STANFORD.N3-to-Bolivia,.,.,.,.,.,.,.,.,.,381.975,368.615,304.993,262.934,227.907,202.485
EDU.SLAC.STANFORD.N3-to-Bosnia Herzegovina,.,.,.,.,.,.,.,.,.,.,207.925,209.180,194.950,203.405,204.102
EDU.SLAC.STANFORD.N3-to-Botswana,.,.,.,.,.,.,.,.,.,.,.,.,416.286,431.282,443.501
EDU.SLAC.STANFORD.N3-to-Brazil,.,.,.,.,.,195.192,213.593,246.179,279.903,208.264,229.659,236.297,238.008,237.791,236.176
EDU.SLAC.STANFORD.N3-to-Brunei,.,.,.,.,.,.,.,309.591,498.171,339.716,269.697,285.392,266.995,265.540,296.008
EDU.SLAC.STANFORD.N3-to-Bulgaria,.,.,.,.,.,.,.,.,.,.,193.049,211.796,202.603,205.785,200.523
EDU.SLAC.STANFORD.N3-to-Burkina Faso,.,.,.,.,.,.,1006.037,1004.097,904.836,765.485,306.416,339.176,321.502,367.969,330.849
EDU.SLAC.STANFORD.N3-to-Burundi,.,.,.,.,.,.,.,.,.,889.260,845.340,665.150,666.138,670.703,686.103
EDU.SLAC.STANFORD.N3-to-Cambodia,.,.,.,.,.,.,.,.,.,.,261.756,253.511,253.505,225.453,233.720
|
The script generate-metric-files-for-explorer.pl converts the metric files in the format below:
| Code Block |
|---|
AFG,1998,
AFG,1999,
AFG,2000,
AFG,2001,
AFG,2002,
AFG,2003,
AFG,2004,
AFG,2005,
AFG,2006,
AFG,2007,767.453
AFG,2008,732.841
AFG,2009,728.492
AFG,2010,750.940
AFG,2011,743.080
ALB,1998,
ALB,1999,
ALB,2000,
ALB,2001,
ALB,2002,
ALB,2003,
ALB,2004,
ALB,2005,
ALB,2006,
ALB,2007,
ALB,2008,234.933
ALB,2009,235.681
ALB,2010,254.324
ALB,2011,225.474
DZA,1998,
DZA,1999,
|
With all the metric files in the above format, a file has to be generated with data for allmetrics altogether as below:
- the concept (even if the value is empty).
- Each value for the concept's id field (here, the country code) must be unique and non-empty (an empty field is one with zero or only whitespace characters).
- Values for properties that reference other concepts must either be empty or be a valid value of the referenced concept.
- Values that contain the comma character must be represented without comma; for example 23,400 must be represented as 23400.
The complete folder that was uploaded to Google Explorer is available here .
Relevant Files
The scripts and files are placed at /afs/slac.stanford.edu/package/pinger/explorer . Two scripts have to be run for generating the data file in the format required by the google data explorer. First script is generate-metric-files-for-explorer.pl . This script takes metric values from prmout folder (http://www-iepm.slac.stanford.edu/pinger/prmout/ AKA /afs/slac/g/www/www-iepm/pinger//prmout (you can use ls -lt /afs/slac/g/www/www-iepm/pinger/prmout/ | grep SLAC | grep allyear | more to find the latest relevant files, see below) and transposes the data such that years are now incremented vertically and not horizontally.
ls -lt /afs/slac/g/www/www-iepm/pinger//prmout/ | grep SLAC | grep allyear | more
-rw-rw-rw- 1 cottrell sf 17108 Jan 4 09:26 unreachability-EDU.SLAC.STANFORD.N3-country-allyearly.csv
-rw-rw-rw- 1 cottrell sf 18886 Jan 4 09:23 ipdv-EDU.SLAC.STANFORD.N3-country-allyearly.csv
-rw-rw-rw- 1 cottrell sf 18524 Jan 4 09:20 packet_loss-EDU.SLAC.STANFORD.N3-country-allyearly.csv
-rw-rw-rw- 1 cottrell sf 21477 Jan 4 09:16 minimum_rtt-EDU.SLAC.STANFORD.N3-country-allyearly.csv
-rw-rw-rw- 1 cottrell sf 18099 Jan 4 09:13 alpha-EDU.SLAC.STANFORD.N3-country-allyearly.csv
-rw-rw-rw- 1 cottrell sf 15112 Jan 4 09:06 MOS-EDU.SLAC.STANFORD.N3-country-allyearly.csv
-rw-rw-rw- 1 cottrell sf 30900 Jan 4 08:48 nthroughput-EDU.SLAC.STANFORD.N3-country-allyearly.csv
-rw-rw-rw- 1 cottrell sf 21426 Jan 4 08:30 throughput-EDU.SLAC.STANFORD.N3-country-allyearly.csv
-rw-rw-rw- 1 cottrell sf 21561 Jan 4 08:27 average_rtt-EDU.SLAC.STANFORD.N3-country-allyearly.csv
-rw-rw-rw- 1 pinger sf 3359 Jan 4 08:08 nthroughput-EDU.SLAC.STANFORD.N3-continent-allyearly.csv
-rw-rw-rw- 1 pinger sf 2190 Jan 4 08:02 minimum_rtt-EDU.SLAC.STANFORD.N3-continent-allyearly.csv
-rw-rw-rw- 1 pinger sf 1837 Jan 4 07:58 ipdv-EDU.SLAC.STANFORD.N3-continent-allyearly.csv
-rw-rw-rw- 1 pinger sf 2196 Jan 4 07:53 average_rtt-EDU.SLAC.STANFORD.N3-continent-allyearly.csv
-rw-rw-rw- 1 pinger sf 1253 Jan 4 07:49 MOS-EDU.SLAC.STANFORD.N3-continent-allyearly.csv
-rw-rw-rw- 1 pinger sf 1754 Jan 4 07:43 unreachability-EDU.SLAC.STANFORD.N3-continent-allyearly.csv
-rw-rw-rw- 1 pinger sf 2225 Jan 4 07:39 throughput-EDU.SLAC.STANFORD.N3-continent-allyearly.csv
-rw-rw-rw- 1 pinger sf 1824 Jan 4 07:34 packet_loss-EDU.SLAC.STANFORD.N3-continent-allyearly.csv
-rw-rw-rw- 1 pinger sf 1485 Jan 4 2014 alpha-EDU.SLAC.STANFORD.N3-continent-allyearly.csv
The above files are updated using the command:
/afs/slac/package/pinger/analysis/wrap-analyze-allyears.pl --basedir /nfs/slac/g/net/pinger --usemetric --dataset hep --set_metric 4
that is run quarterly from a trscontab file, thus you should not need to do anything.
The files generated by /afs/slac/package/pinger/explorer/generate-metric-files-for-explorer.pl are:
326cottrell@rhel6-64i:~$ls -lt /afs/slac.stanford.edu/package/pinger/explorer
total 639
-rw-rw-r-- 1 amberzeb sg 36293 Jan 4 09:37 MOS.csv
-rw-rw-r-- 1 amberzeb sg 42913 Jan 4 09:37 average_rtt.csv
-rw-rw-r-- 1 amberzeb sg 40238 Jan 4 09:37 ipdv.csv
-rw-rw-r-- 1 amberzeb sg 42829 Jan 4 09:37 minimum_rtt.csv
-rw-rw-r-- 1 amberzeb sg 51327 Jan 4 09:37 nthroughput.csv
-rw-rw-r-- 1 amberzeb sg 39876 Jan 4 09:37 packet_loss.csv
-rw-rw-r-- 1 amberzeb sg 40887 Jan 4 09:37 throughput.csv
-rw-rw-r-- 1 amberzeb sg 35982 Jan 4 09:37 unreachability.csv
These are then given as an input to the script generate-alldata-for-pinger-data-explorer.pl (I think /afs/slac.stanford.edu/package/pinger/explorer/generate-alldata-file-for-pinger-data-explorer.pl), which outputs the data for all the metrics altogether in one file named file.csv. This file is in the format as required by the google data explorer.
The metric files placed in prmout, for example, average_rtt-EDU.SLAC.STANFORD.N3-country-allyearly.csv have the data in the format shown below:
| Code Block |
|---|
allyearly,?,1998,1999,2000,2001,2002,2003,2004,2005,2006,2007,2008,2009,2010,2011
EDU.SLAC.STANFORD.N3-to-Afghanistan,.,.,.,.,.,.,.,.,.,.,767.453,732.841,728.492,750.940,743.080
EDU.SLAC.STANFORD.N3-to-Albania,.,.,.,.,.,.,.,.,.,.,.,234.933,235.681,254.324,225.474
EDU.SLAC.STANFORD.N3-to-Algeria,.,.,.,.,.,.,.,.,197.772,271.337,354.233,242.616,369.479,224.162,239.514
EDU.SLAC.STANFORD.N3-to-Andorra,.,.,.,.,.,.,.,.,.,.,171.471,166.487,172.334,180.878,181.307
EDU.SLAC.STANFORD.N3-to-Angola,.,.,.,.,.,.,.,.,.,622.280,610.272,642.821,556.701,617.649,.
EDU.SLAC.STANFORD.N3-to-Argentina,.,.,.,.,.,.,.,.,.,210.563,196.282,269.567,284.886,285.094,310.711
EDU.SLAC.STANFORD.N3-to-Armenia,.,.,.,.,.,.,553.942,433.564,590.536,613.230,532.564,370.588,255.761,248.554,237.400
EDU.SLAC.STANFORD.N3-to-Australia,.,.,.,.,.,.,.,.,.,211.440,193.981,180.105,181.620,190.176,179.072
EDU.SLAC.STANFORD.N3-to-Austria,.,.,.,.,.,.,.,.,.,.,180.361,185.830,178.831,180.726,180.207
EDU.SLAC.STANFORD.N3-to-Azerbaijan,.,.,.,.,.,.,.,.,.,.,.,257.763,269.463,256.694,252.713
EDU.SLAC.STANFORD.N3-to-Bahamas,.,.,.,.,.,.,.,.,.,.,.,109.626,110.701,817.097,112.252
EDU.SLAC.STANFORD.N3-to-Bahrain,.,.,.,.,.,.,.,.,.,.,664.547,333.670,316.139,313.444,295.960
EDU.SLAC.STANFORD.N3-to-Bangladesh,.,.,.,.,.,1562.224,1222.391,1039.782,1084.855,842.794,545.756,496.707,426.840,350.780,371.552
EDU.SLAC.STANFORD.N3-to-Belarus,.,.,.,.,.,.,1770.143,2322.474,227.052,206.936,205.880,222.485,258.829,281.173,205.689
EDU.SLAC.STANFORD.N3-to-Belgium,.,.,.,.,.,.,.,.,.,.,158.697,160.445,158.798,164.117,160.686
EDU.SLAC.STANFORD.N3-to-Benin,.,.,.,.,.,.,.,.,417.760,535.608,382.265,366.215,485.181,377.928,331.121
EDU.SLAC.STANFORD.N3-to-Bhutan,.,.,.,.,.,.,.,.,.,.,.,622.936,356.257,327.709,332.479
EDU.SLAC.STANFORD.N3-to-Bolivia,.,.,.,.,.,.,.,.,.,381.975,368.615,304.993,262.934,227.907,202.485
EDU.SLAC.STANFORD.N3-to-Bosnia Herzegovina,.,.,.,.,.,.,.,.,.,.,207.925,209.180,194.950,203.405,204.102
EDU.SLAC.STANFORD.N3-to-Botswana,.,.,.,.,.,.,.,.,.,.,.,.,416.286,431.282,443.501
EDU.SLAC.STANFORD.N3-to-Brazil,.,.,.,.,.,195.192,213.593,246.179,279.903,208.264,229.659,236.297,238.008,237.791,236.176
EDU.SLAC.STANFORD.N3-to-Brunei,.,.,.,.,.,.,.,309.591,498.171,339.716,269.697,285.392,266.995,265.540,296.008
EDU.SLAC.STANFORD.N3-to-Bulgaria,.,.,.,.,.,.,.,.,.,.,193.049,211.796,202.603,205.785,200.523
EDU.SLAC.STANFORD.N3-to-Burkina Faso,.,.,.,.,.,.,1006.037,1004.097,904.836,765.485,306.416,339.176,321.502,367.969,330.849
EDU.SLAC.STANFORD.N3-to-Burundi,.,.,.,.,.,.,.,.,.,889.260,845.340,665.150,666.138,670.703,686.103
EDU.SLAC.STANFORD.N3-to-Cambodia,.,.,.,.,.,.,.,.,.,.,261.756,253.511,253.505,225.453,233.720
|
The script /afs/slac.stanford.edu/package/pinger/explorer/generate-metric-files-for-explorer.pl converts the metric files in the format below:
| Code Block |
|---|
AFG,1998,
AFG,1999,
AFG,2000,
AFG,2001,
AFG,2002,
AFG,2003,
AFG,2004,
AFG,2005,
AFG,2006,
AFG,2007,767.453
AFG,2008,732.841
AFG,2009,728.492
AFG,2010,750.940
AFG,2011,743.080
ALB,1998,
ALB,1999,
ALB,2000,
ALB,2001,
ALB,2002,
ALB,2003,
ALB,2004,
ALB,2005,
ALB,2006,
ALB,2007,
ALB,2008,234.933
ALB,2009,235.681
ALB,2010,254.324
ALB,2011,225.474
DZA,1998,
DZA,1999,
|
With all the metric files in the above format, a file has to be generated with data for allmetrics altogether as below:
| Code Block |
|---|
ountry,year,population,average_rtt,ipdv,minimum_rtt,MOS,nthroughput,throughput,unreachability,packet_loss,internetusers
FG,1998,18511480, , , , , , , , ,
FG,1999,19038420, , , , , , , , ,
FG,2000,19701940, , , , , , , , ,
FG,2001,20531160, , , , , , , , ,1000
AFG,2002,21487079, , , , , , , , ,1000
AFG,2003,22507368, , , , , , , , ,20000
AFG,2004,23499850, , , , , , , , ,25000
AFG,2005,24399948, , , , , , , , ,300000
AFG,2006,25183615, , , , , , , , ,535000
AFG,2007,25877544,766.542,14.959,684.521, , ,104.390,12.784,12.784,500000
AFG,2008,26528741,732.168,11.963,688.990, , ,185.696,6.971,6.971,500000
AFG,2009,27207291,757.940,15.615,679.949, , ,162.520,9.399,9.399,100000
AFG,2010,27962207,758.457,16.102,673.438, , ,145.039,4.791,4.791,900472.2222
AFG,2011,28809167,748.252,12.247,695.982, , ,182.375,1.448,1.448,1016522.222
AFG,2012,29726803,742.298,12.135,696.738, , ,289.165,27.145,27.145,
AFG,2013,30682500,729.152,13.043,561.894, , ,335.934,37.886,37.886,
AFG,2014,31627506,506.886,5.919,306.091, , ,303.197,0.232,0.232,
AFG,2015,32510236,334.816,2.335,161.226, , ,392.257,0.214,0.214,
AFG,2016,34832396,310.830,2.485,275.268, , ,585.247,0.572,0.572,
AFG,2017,69664776,289.552,0.982,256.032, , ,694.266,0.580,0.580,
AFG,2018,71406395,290.077,3.220,263.951, , ,865.366,16.359,16.359,
AFG,2019,73148014,272.802,1.064,232.858, , ,800.593,0.255,0.255,
ALB,1998,3128530, , , , , , , , ,2000
ALB,1999,3108778, , , , , , , , ,2500
ALB,2000,3089027, , , , , , , , ,3500
ALB,2001,3060173, , , , , , , , ,10000
ALB,2002,3051010, , , , , , , , ,12000
ALB,2003,3039616, , , , , , , , ,30000
ALB,2004,3026939, , , , , , , , ,75000
ALB,2005,3011487, , , , , , , , ,188000
ALB,2006,2992547, , , , , , , , ,300000
ALB,2007,2970017, , , , , , , , ,471000
ALB,2008,2947314,234.798,1.700,211.463, , ,692.675,1.204,1.204,750000
ALB,2009,2927519,227.456,2.672,201.217, , ,478.448,2.437,2.437,1300000
ALB,2010,2913021,240.834,4.107,210.101, , ,323.681,2.985,2.985,719805.7143
ALB,2011,2904780,219.940,0.858,192.671, , ,669.506,0.476,0.476,783557.6786
ALB,2012,2900489,217.436,0.661,183.491, , ,1324.090,0.839,0.839,
ALB,2013,2897366,215.515,7.396,178.691, , ,503.866,0.086,0.086,
ALB,2014,2894475,210.308,1.616,176.654, , ,839.650,0.126,0.126,
ALB,2015,3540536,209.244,0.606,191.528, , ,868.063,0.111,0.111,
ALB,2016,3793431,199.113,2.030,182.726, , ,915.164,0.240,0.240,
ALB,2017,11949284,203.075,5.471,176.711, , ,837.439,0.932,0.932,
ALB,2018,12138955,183.536,1.630,175.506, , ,816.885,0.315,0.315,
ALB,2019,12328626,187.683,1.180,179.347, , ,991.819,0.471,0.471,
DZA,1998,30336880, , , , , , , , ,6000
DZA,1999,30766551, , , , , , , , ,60000
|
| Code Block |
|---|
#country,year,population,average_rtt,ipdv,minimum_rtt,MOS,nthroughput,throughput,unreachability,packet_loss,internetusers,
#Internet_Penetration, DOI, HDI, CPI, IDI
AFG,1998,22441529, , , , , , , , ,,0.1,0,0,0,0
AFG,1999,23028254, , , , , , , , ,,0.1,0,0,0,0
AFG,2000,23630320, , , , , , , , ,,0.1,0,0,0,0
AFG,2001,24232219, , , , , , , , ,1000,0.1,0,0,0,0
AFG,2002,24849449, , , , , , , , ,1000,0.1,0,0,0,0
AFG,2003,25482401, , , , , , , , ,20000,0.1,0,0,0,0
AFG,2004,26131476, , , , , , , , ,25000,0.1,0,0.347,0,0
AFG,2005,26797083, , , , , , , , ,300000,0.1,0,0.347,2.5,0
AFG,2006,27518809, , , , , , , , ,535000,0.1,0,0.35,0,0
AFG,2007,28259973,767.453,13.43,697.938,1.2,100.822,100.822,12.859,2.279,500000,0.1,0,0.352,1.8,0
AFG,2008,29021099,732.841,8.295,696.396,1.5,175.8,175.8,4.813,0.836,500000,0.1,0,0.352,1.5,0
AFG,2009,29802724,728.492,6.604,687.919,1.6,216.936,216.936,9.495,0.564,1000000,1.5,0,0.352,1.3,0
AFG,2010,30175351,750.94,10.811,675.284,1.5,128.965,128.965,7.024,2.279,900472.2222,1.5,0,0.352,1.3,0
AFG,2011,30823706,743.08,9.967,684.141,1.7,142.843,142.843,9.709,1.534,1016522.222,1.5,0,0.352,1.3,0
ALB,1998,3075628 |
| Code Block |
#country,year,population,average_rtt,ipdv,minimum_rtt,MOS,nthroughput,throughput,unreachability,packet_loss,internetusers AFG,1998,22441529, , , , , , , , , AFG,1999,23028254, , , , , , , , , AFG,2000,23630320, , , , , , , , ,2000,2.4,0.36,0.784,0,0 AFGALB,20011999,242322193069856, , , , , , , , ,1000 AFG,2002,24849449,2500,2.4,0.36,0.784,0,0 ALB,2000,3067556, , , , , , , , ,1000 AFG,2003,25482401,3500,2.4,0.36,0.784,0,0 ALB,2001,3069383, , , , , , , , ,20000 AFG,2004,26131476, , , ,10000,2.4,0.36,0.784,0,0 ALB,2002,3076282, , , , , ,25000 AFG,2005,26797083, , , , 12000, , , , ,300000 AFG,2006,275188092.4,0.36,0.801,2.5,1.92 ALB,2003,3086736, , , , , , , , ,535000 AFG,2007,28259973,767.453,13.430,697.938,1.2,100.822,100.822,12.859,2.279,500000 AFG,2008,29021099,732.841,8.295,696.396,1.5,175.800,175.800,4.813,0.836,500000 AFG,2009,29802724,728.492,6.604,687.919,1.6,216.936,216.936,9.495,0.564,1000000 AFG,2010,30175351,750.940,10.811,675.284,1.5,128.965,128.965,7.024,2.279,900472.2222 AFG,2011,30823706,743.080,9.967,684.141,1.7,142.843,142.843,9.709,1.534,1016522.222 ALB,1998,307562830000,2.4,0.36,0.801,2.5,1.92 ALB,2004,3098677, , , , , , , , ,75000,2.4,0.36,0.811,2.5,1.92 ALB,2005,3110579, , , , , , , , ,188000,2.4,0.36,0.811,2.4,1.92 ALB,2006,3121751, , , , , , , , ,300000,2.4,0.37,0.814,2.6,1.92 ALB,2007,3132458, , , , , , , , ,2000471000,2.4,0.37,0.818,2.9,2.73 ALB,1999,30698562008, 3143291, , , , , , , ,2500 ALB,2000,3067556, , , , , , , , ,3500 ALB,2001,3069383, , , , , , , , ,10000 ALB,2002,3076282, , , , , , , , ,12000 ALB,2003,3086736, , , , , , , , ,30000 ALB,2004,3098677, , , , , , , , ,75000 ALB,2005,3110579, , , 234.933,5.869,204.462,4,584.968,584.968,8.125,0.728,750000,2.4,0.37,0.818,3.4,2.73 ALB,2009,3155271,235.681,7.91,197.166,3.9,527.683,527.683,7.358,0.884,1300000,16,0.37,0.818,3.2,2.73 ALB,2010,3140420,254.324,10.106,199.379,3.8,406.381,406.381,4.935,1.613,719805.7143,16,0.37,0.818,3.2,2.73 ALB,2011,3145807,225.474,1.847,200.22,4,602.674,602.674,24.037,0.759,783557.6786,16,0.37,0.818,3.2,2.73 DZA,1998,29646386, , , , , ,188000 ALB,2006,3121751, , , , 6000, , , , ,300000 ALB,2007,31324582.6,0.39,0.713,0,0 DZA,1999,30071594, , , , , , , , ,471000 ALB,2008,3143291,234.933,5.869,204.462,4,584.968,584.968,8.125,0.728,750000 ALB,2009,3155271,235.681,7.910,197.166,3.9,527.683,527.683,7.358,0.884,1300000 ALB,2010,3140420,254.324,10.106,199.379,3.8,406.381,406.381,4.935,1.613,719805.7143 ALB,2011,3145807,225.474,1.847,200.220,4,602.674,602.674,24.037,0.759,783557.6786 DZA,1998,29646386, , , , , , , , ,600060000,2.6,0.39,0.713,0,0 DZA,2000,30506054, , , , , , , , ,150000,2.6,0.39,0.713,0,0 |
This is the format required by Google data Explorer. The file in above format is generated by running the script /afs/slac.stanford.edu/package/pinger/explorer/generate-alldata-file-for-pinger-data-explorer.pl which takes the files generated by/afs/slac.stanford.edu/package/pinger/explorergenerate-metric-files-for-explorer.pl as input files and outputs a file named 'file.csv' with all the metric data in the format required by Google Data Explorer.
It is important to note here that the CPI, IDI, HDI, DOI and Internet Penetration data has been taken from Motion chart data files (demographics.csv) placed at /afs/slac.stanford.edu/package/pinger/motion-chart.
Implementation
Following is the algo of implementation:
...
The files have to be generated manually and uploaded manually. There is no crontab that is running these scripts to generate files and the folder to be uploaded. These files need to be updated each year. . Once the data set is uploaded, it checks for errors. If there are no errors then you can preview the data and once it is up to the mark, publish the dataset.
Miscellaneous Details
- Tool: The interactive graph was generated using the Google Public Data Explorergraph was generated using the Google Public Data Explorer. Also see https://www.google.com/publicdata/directory
- Now the data for Pinger Data Explorer is under pinger.slac@gmail.com (May/2016).
- Data: The data presented here was collected by the PingER project, processed by prmout. The same data is available in tabular format. The statistics of Population and internet users were acquired from the World bank , the country to region mapping was obtained by the geographical database maintained by the PingER project, the Corruption Perception Index (CPI) was taken from Transparency International and extracted from Wikipedia , the Digital Opportunity Index (DOI) is obtained from ITU's ICT Statistics , Human Development Index (HDI) is obtained from UNDP Human development reports and ICT Development Index (IDI) is obtained from ITU Reports .
- Please note that while all the statistics were acquired over several years (i.e. since 1998), the Internet usage statistics were documented in Nov. 2007.
- Loading: The time to load and render the web page is largely determined speed of the link, the file length (about a MByte that is determined by the number of metrics and frequency of data points and the number of metrics) and the speed of the client rendering.
- Metrics: Average RTT (ms), Normalized Throughput (Kbps), Throughput (Kbps), Internet Users (#), Population (#), Minimum RTT (ms), Packet Loss (%), Unreachability (%), IPDV (ms), MOS, IDI, HDI, DOI, CPI and Internet penetration Index.
- Authors: Faisal Zahid & Amber Zeb 29/8/2011. Idea champion: Faisal Zahid.
...