Using a Web browser
Opening the ftp site using Chrome gives a result similar to belowWhen I try and open the ftp using Chrome I get:
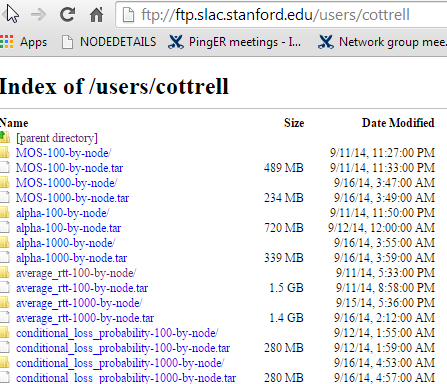
Is this what you see?
When I click on Clicking on say average_rtt-100-by-node/ then results in Chrome I get:
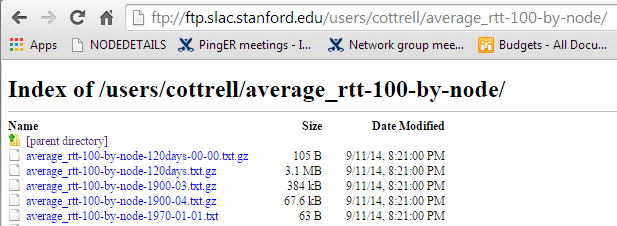
Scroll down to some recent data, e.g. average_rtt-100-by-node-2014-09-10.txt.gz. Click on it and in Chrome The the file appears at the bottom left
...
Drag this file to a more permanent place (e.g. your desktop). Then you have to unzip it. How you do that depends on your OS. I would do it in Unix. So I copy it to a Unix host and use gunzip. On windows I copy it to the desktop and the use WinRAR (you may need to download) to unzip and look at.
From a Unix command line
Use wget, e.g to download a file into the working directory:
$wget 'ftp://ftp.slac.stanford.edu/users/cottrell/average_rtt-100-by-node-2014-09-10.txt.gz'
You will probably want to write a script to get all the data.
Then use gunzip to unzip the data
Metrics available
average_rtt/                   out_of_order_packets/
conditional_loss_probability/  packet_loss/
duplicate_packets/             throughput/
ipdv/                          unpredictability/
iqr/                           unreachability/
minimum_packet_loss/           zero_packet_loss_frequency/
minimum_rtt/                   maximum_rtt/
MOS/                           alpha/
See the Tutorial for more on the metrics.
Updating the information
It takes a long time to download all the information (dating back to 1998) from the PingER archive. Thus this is typically done once. Thus hourly data for the last 6 months is therefore made available in directories of the form /users/cottrell/<metric-size-by>/. This data is updated daily. See below for an example:
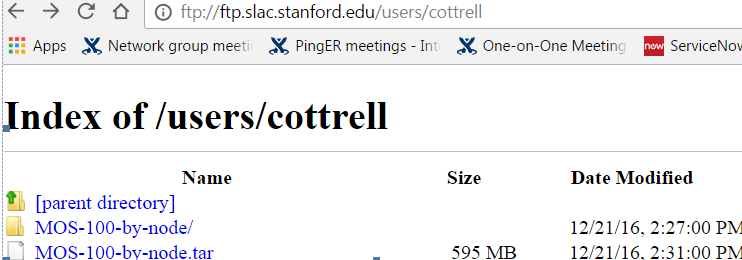
These directories contains the daily files that contain the hourly data for the last 6 months:
The idea is that the analysis site uploads all the available data from the tar files and then one time can update its files for the last few days using this data from the metric directory, rather than transferring the full tar file (that contains many Gbytes compared to the hundreds of GBytes in the daily files).
Format of the file
There is a copy of the file here.
...
airuniversity.seecs.edu.pk is the source (monitoring host), mail.gnet.tn is the name of the host being monitored, 141.522 is the RTT seen at 0 hours, 141.515 is the RTT at 1am etc.
More information