...
I can't say I see any compelling correspondence with Philippe's plots. Note that these runs are on successive orbits. Each started and stopped with the ascending node crossing the equator.
| 633997253 |
|
| 634002957 |
|

(SD, 22 Feb 2021)
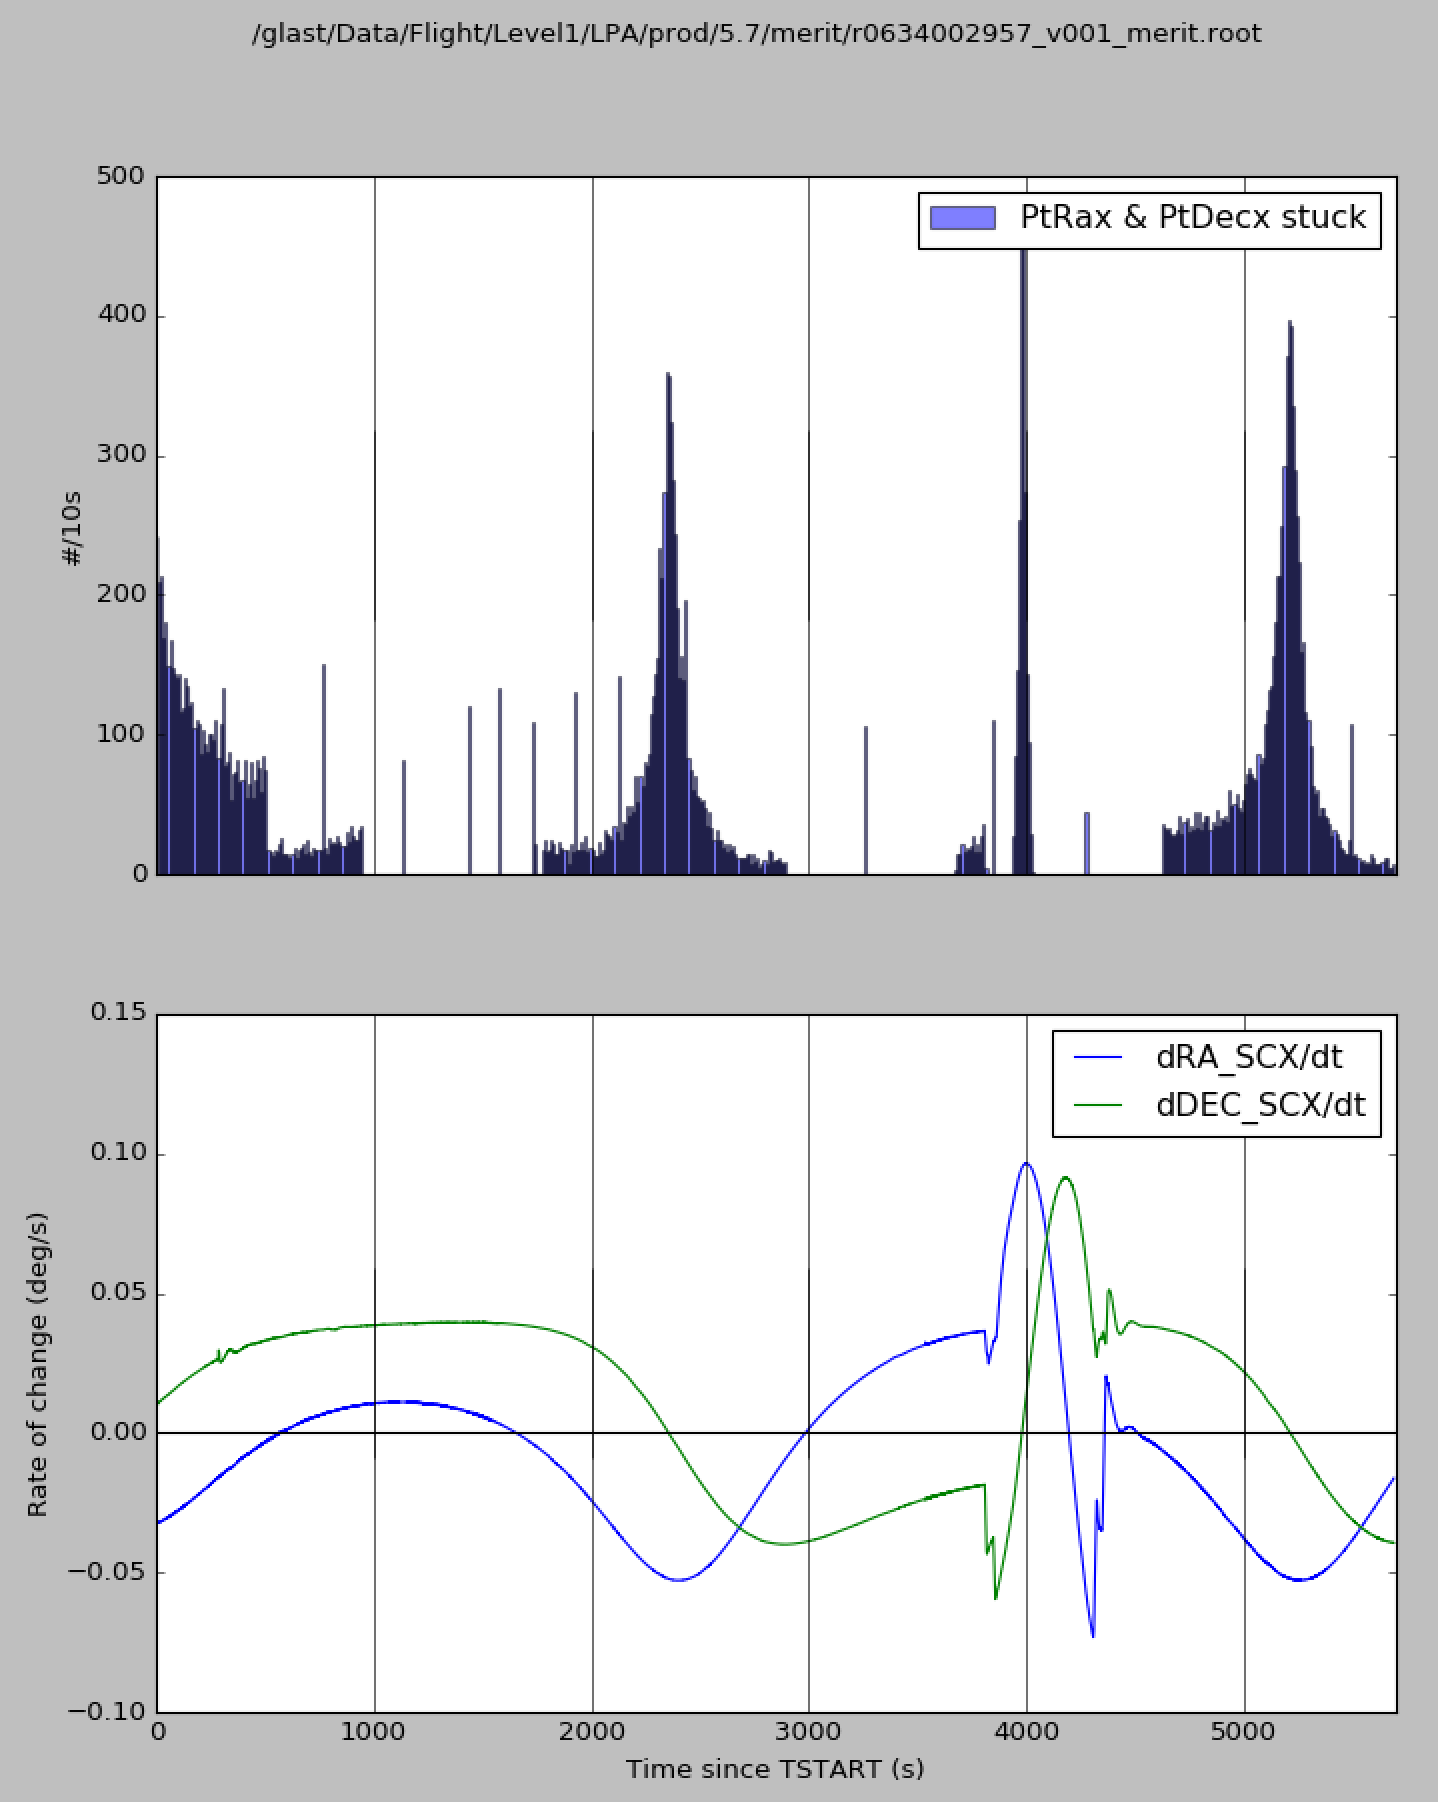
The broad features indicating 'stuck' spacecraft pointing directions in Philippe's plots above seem to indicate just conditions when the coordinates are in fact not changing very quickly and successive events can in fact have the same reported spacecraft orientation. Here is a comparison of the rate of events with the same PtRax and PtDecx as the previous event in the Merit file with the rates of change of RA_SCX and DEC_SCX from the pointing history file for r0634002957_v001_merit.root and gll_pt1s_p310_r0634002957_v000.fit. The histogram in the upper panel is consistent with Philippe's (with different binning in time). The broad peaks correspond to times when DEC_SCX in particular is changing only slowly. This indicates that the broad features in the 'stuck' pointing plots are not an issue with the interpolation. (I get different profiles from Philippe's plot for PtRaz and PtDecz but I think the same explanation applies for 'stuck' spacecraft orientation for them as well.)